


Content: # Drowning in Pipeline Dashboards? 4 Steps to Find the Metrics That Matter
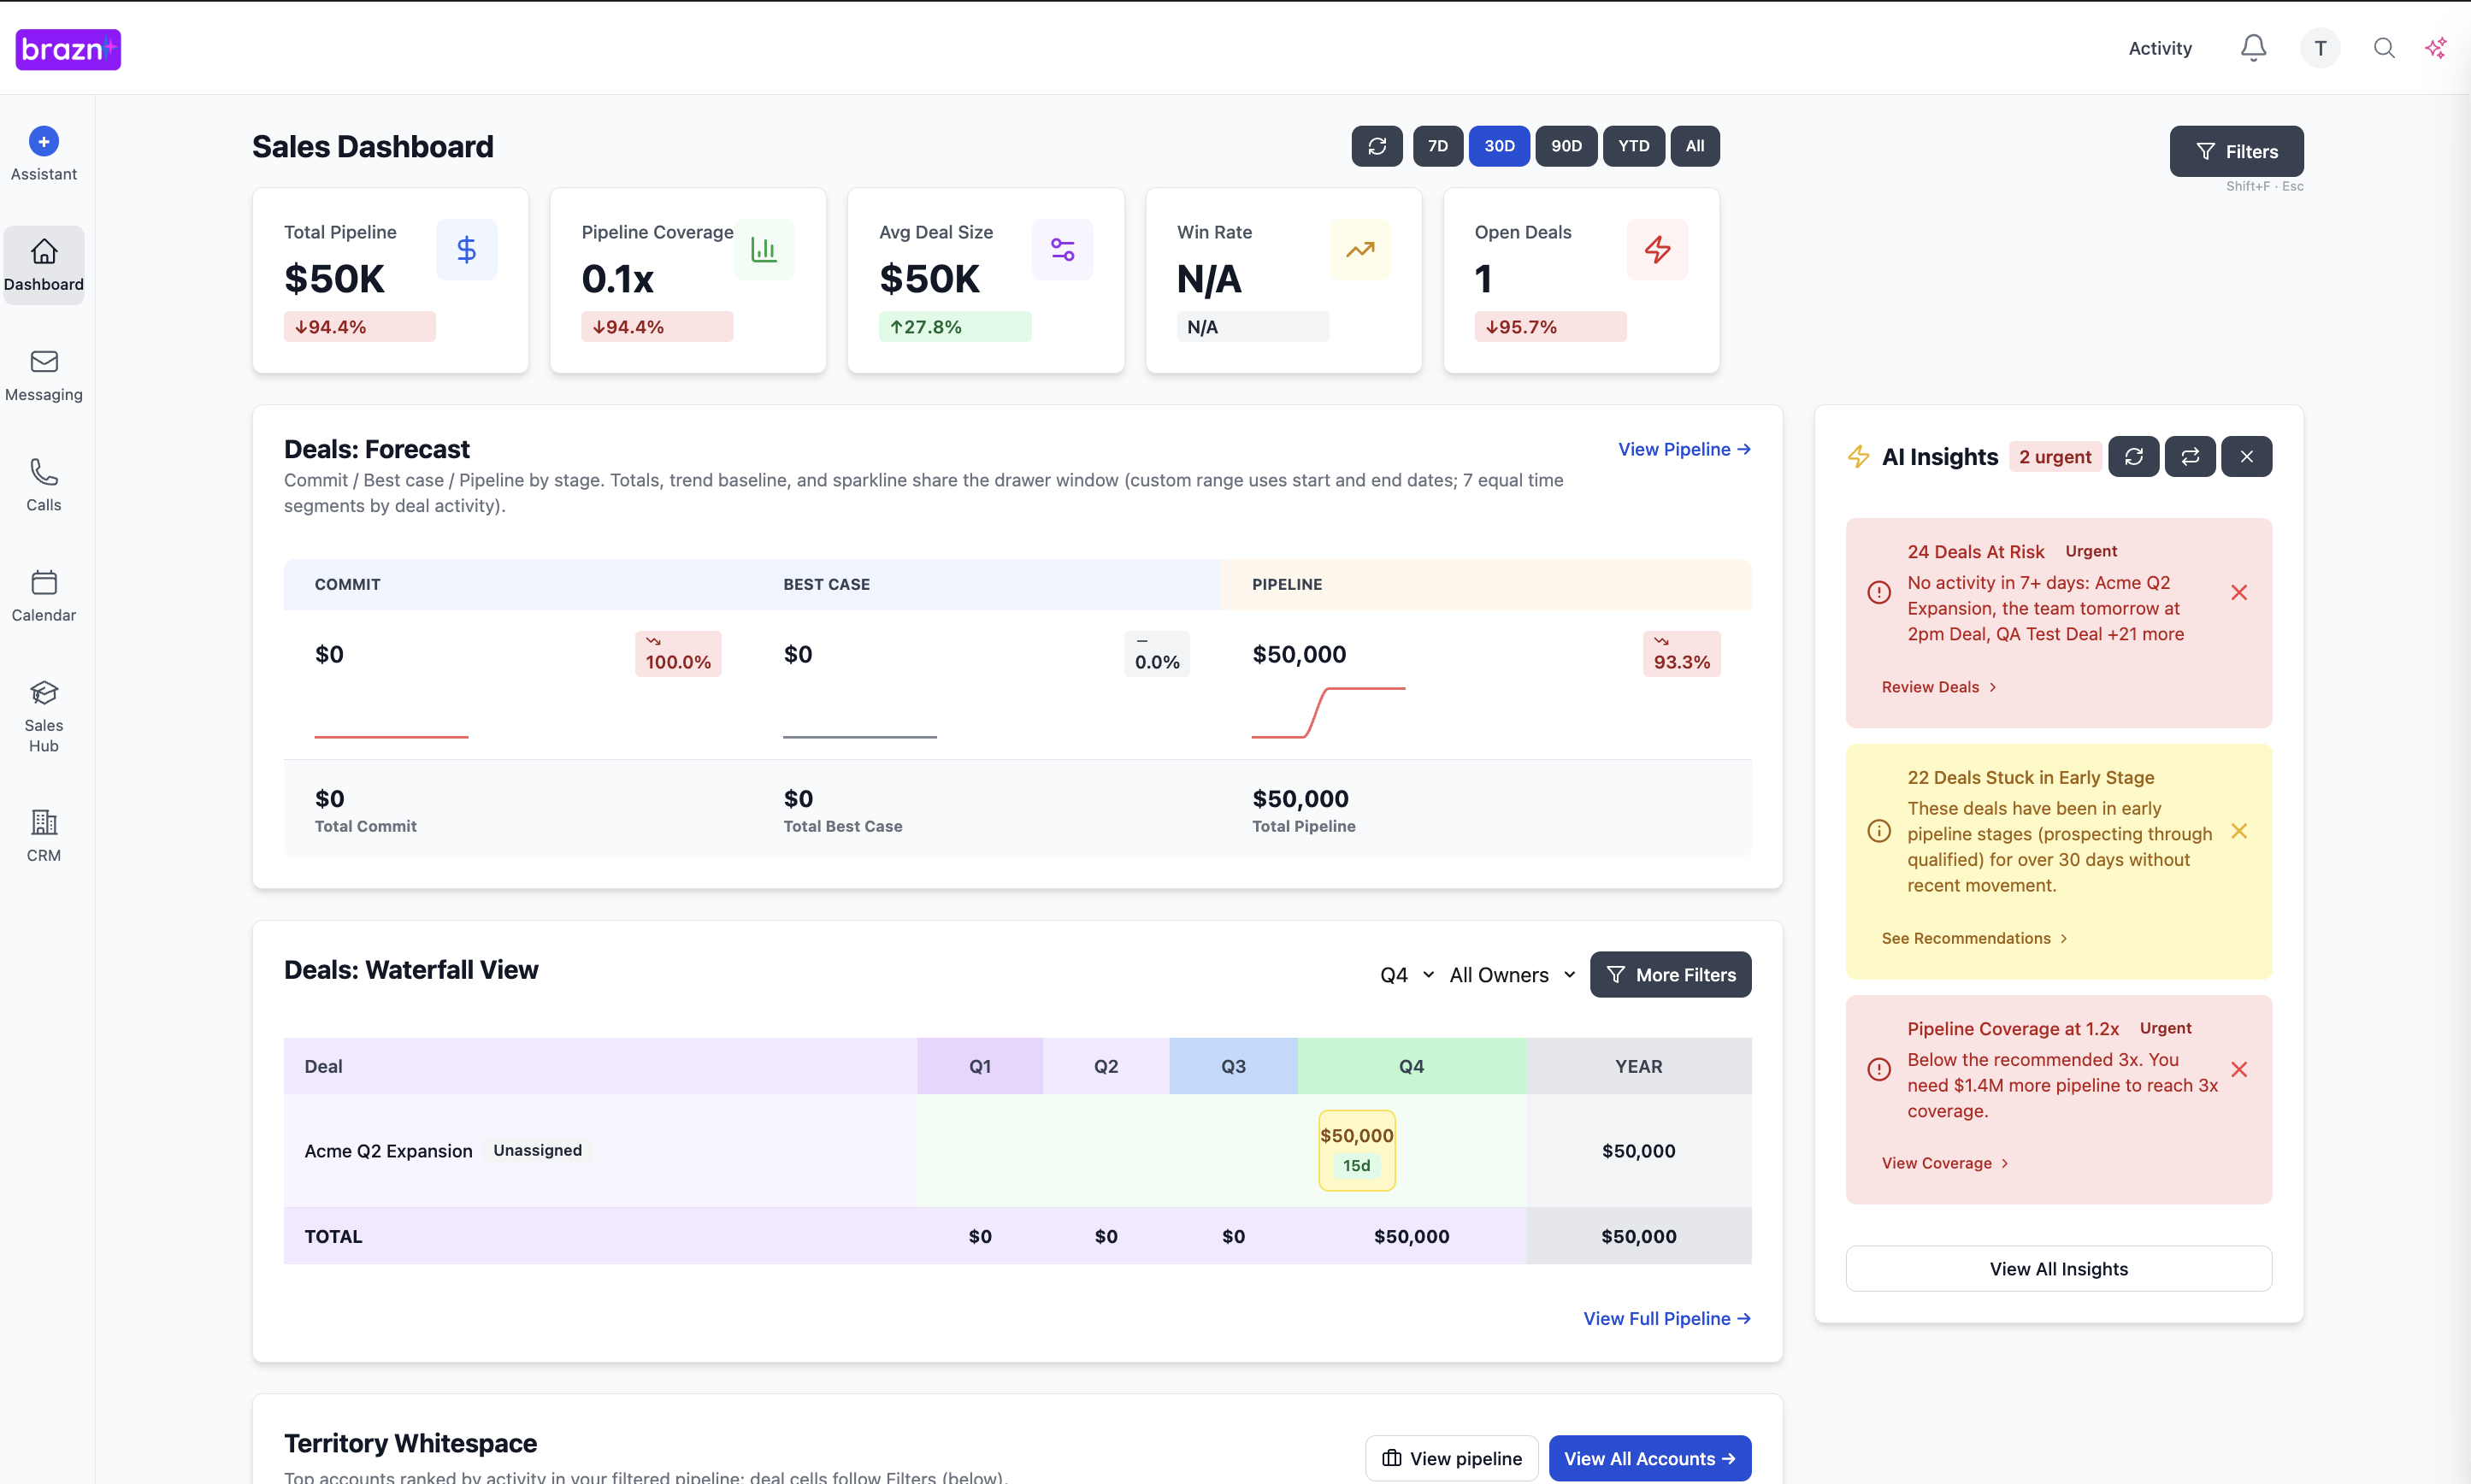
Revenue leaders today have access to more data than ever before. CRMs are overflowing with custom fields, and BI tools can generate hundreds of different charts. Yet, despite this abundance of information, many leaders still struggle to answer a simple question: “Are we going to hit our number this quarter?”
The problem is dashboard fatigue. When you try to track everything, you end up tracking nothing. Leaders become overwhelmed by vanity metrics and contradictory data points, leading to analysis paralysis—and a failure to identify the true health of the pipeline.
This article provides a framework for cutting through the noise. We’ll outline 4 actionable steps to help you declutter your dashboards, identify the leading indicators that actually predict revenue, and build a streamlined reporting system that drives confident decision-making.
What we’ll cover
In this article, we will cover:
- Why more data doesn’t always equal better insights
- The difference between vanity metrics and leading indicators
- 4 steps to identify the pipeline metrics that matter
- How to build a single, actionable revenue dashboard
- How to create a culture of data-driven decision-making
Understanding the approach
Finding the “metrics that matter” means shifting focus from lagging indicators (like closed-won revenue, which tells you what happened in the past) to leading indicators (like pipeline velocity and meeting conversion rates, which predict what will happen in the future).
In RevOps, this is about creating a strong “signal-to-noise” ratio so leaders can spot trends and intervene before a quarter is lost.
Example: A sales manager might obsess over the total number of calls made by their SDR team (a vanity metric). A more effective approach is to track the “calls-to-meaningful-conversation” ratio (a leading indicator). If total call volume is high but the conversation ratio drops, the manager knows immediately that the messaging or list quality needs to be adjusted.
Why this matters
Streamlining your metrics is crucial for aligning the GTM team and ensuring everyone is focused on the activities that actually drive revenue.
- Before: Leadership meetings are spent debating which dashboard is accurate, wasting valuable time. After: Everyone works from a single source of truth, allowing meetings to focus on strategy and execution.
- Before: Managers react to missed targets after the quarter ends—when it’s too late to make a difference. After: Managers use leading indicators to proactively identify risks and adjust tactics mid-quarter.
- Before: Reps are confused about what activities they’re being measured on. After: Reps have clear, actionable goals tied directly to the metrics that matter.
The complete guide
Step 1: Define your North Star metric
Objective: Align the entire revenue organization around a single, overarching goal.
Actionable advice: Identify the one metric that best represents the overall health and growth of your business (e.g., Net New ARR, Net Revenue Retention). Every other metric you track should ultimately roll up to this North Star.
Best practices: Ensure your North Star metric is easily understood by everyone on the team—from the SDR to the CEO.
Step 2: Map the buyer journey
Objective: Understand the key milestones a prospect must pass to become a customer.
Actionable advice: Document the typical stages a buyer goes through, from initial awareness to closed-won. Identify the specific actions that indicate a prospect is moving from one stage to the next (e.g., attending a demo, completing a security review).
Best practices: Base this map on actual customer data—not just your internal sales process.
Step 3: Identify leading indicators for each stage
Objective: Select the metrics that predict success at each milestone in the buyer journey.
Actionable advice: For each stage identified in Step 2, choose 1–2 metrics that indicate velocity and conversion. For example, at the “Demo” stage, track the “Demo-to-Proposal” conversion rate and the average time spent in the Demo stage.
Best practices: Focus on rates and ratios rather than absolute numbers, as they provide a better indication of efficiency.
Step 4: Ruthlessly prune your dashboards
Objective: Eliminate any metric that doesn’t directly inform a business decision.
Actionable advice: Review your existing dashboards and ask of every chart: “If this number goes up or down, what specific action will we take?” If you can’t answer that question, remove the chart.
Best practices: Limit your primary revenue dashboard to no more than 6–8 key metrics. If you need more detail, create secondary, drill-down reports.
How to implement this
RevOps must take the lead in decluttering dashboards. Work closely with Sales and Marketing leadership to agree on metric definitions and ensure underlying data is accurate.
Once the new, streamlined dashboard is built, RevOps must enforce its use—resisting ad hoc, one-off reporting that distracts from the core metrics. Enablement should train managers on how to interpret the new dashboard and use it to coach reps effectively.
Next steps
You don’t need more data to run a successful revenue team; you need the right data. By focusing on a small set of leading indicators, you can gain a clear, accurate view of your pipeline and make proactive decisions that drive growth.
Start by reviewing your primary sales dashboard today. Identify three metrics that you rarely look at (or don’t know how to act on), and delete them. See how much clearer the picture becomes. Ready to build dashboards that actually drive revenue? See how Brazn’s analytics platform surfaces the insights that matter.
Deals
Drowning in Pipeline Dashboards? 4 Steps to Find the Metrics That Matter
Revenue leaders today have access to more data than ever before. CRMs are overflowing with custom fields, and BI tools can generate hundreds of different charts. Yet, despite this abundance of information, many leaders still struggle to answer a simple question: “Are we going to hit our number this quarter?”
The problem is dashboard fatigue. When you try to track everything, you end up tracking nothing. Leaders become overwhelmed by vanity metrics and contradictory data points, leading to analysis paralysis—and a failure to identify the true health of the pipeline.
This article provides a framework for cutting through the noise. We’ll outline 4 actionable steps to help you declutter your dashboards, identify the leading indicators that actually predict revenue, and build a streamlined reporting system that drives confident decision-making.
What we’ll cover
- Why more data doesn’t always equal better insights
- The difference between vanity metrics and leading indicators
- 4 steps to identify the pipeline metrics that matter
- How to build a single, actionable revenue dashboard
- How to create a culture of data-driven decision-making
Understanding the approach
Finding the “metrics that matter” means shifting focus from lagging indicators (like closed-won revenue, which tells you what happened in the past) to leading indicators (like pipeline velocity and meeting conversion rates, which predict what will happen in the future).
In RevOps, this is about creating a strong “signal-to-noise” ratio so leaders can spot trends and intervene before a quarter is lost.
Example: A sales manager might obsess over the total number of calls made by their SDR team (a vanity metric). A more effective approach is to track the “calls-to-meaningful-conversation” ratio (a leading indicator). If total call volume is high but the conversation ratio drops, the manager knows immediately that the messaging or list quality needs to be adjusted.Why this matters
Streamlining your metrics is crucial for aligning the GTM team and ensuring everyone is focused on the activities that actually drive revenue in the sales pipeline.
- Before: Leadership meetings are spent debating which dashboard is accurate, wasting valuable time.
After: Everyone works from a single source of truth, allowing meetings to focus on strategy and execution.- Before: Managers react to missed targets after the quarter ends—when it’s too late to make a difference.
After: Managers use leading indicators to proactively identify risks and adjust tactics mid-quarter.- Before: Reps are confused about what activities they’re being measured on.
After: Reps have clear, actionable goals tied directly to the metrics that matter.The complete guide
Step 1: Define your North Star metric
Objective: Align the entire revenue organization around a single, overarching goal. Actionable advice: Identify the one metric that best represents the overall health and growth of your business (e.g., Net New ARR, Net Revenue Retention). Every other metric you track should ultimately roll up to this North Star. Best practices: Ensure your North Star metric is easily understood by everyone on the team—from the SDR to the CEO.Step 2: Map the buyer journey
Objective: Understand the key milestones a prospect must pass to become a customer. Actionable advice: Document the typical stages a buyer goes through, from initial awareness to closed-won. Identify the specific actions that indicate a prospect is moving from one stage to the next (e.g., attending a demo, completing a security review). Best practices: Base this map on actual customer data—not just your internal sales process.Step 3: Identify leading indicators for each stage
Objective: Select the metrics that predict success at each milestone in the buyer journey. Actionable advice: For each stage identified in Step 2, choose 1–2 metrics that indicate velocity and conversion. For example, at the “Demo” stage, track the “Demo-to-Proposal” conversion rate and the average time spent in the Demo stage. Best practices: Focus on rates and ratios rather than absolute numbers, as they provide a better indication of efficiency.Step 4: Ruthlessly prune your dashboards
Objective: Eliminate any metric that doesn’t directly inform a business decision. Actionable advice: Review your existing dashboards and ask of every chart: “If this number goes up or down, what specific action will we take?” If you can’t answer that question, remove the chart. Best practices: Limit your primary revenue dashboard to no more than 6–8 key metrics. If you need more detail, create secondary, drill-down reports.How to implement this
RevOps must take the lead in decluttering dashboards. Work closely with Sales and Marketing leadership to agree on metric definitions and ensure underlying data is accurate.
Once the new, streamlined dashboard is built, RevOps must enforce its use—resisting ad hoc, one-off reporting that distracts from the core metrics. Enablement should train managers on how to interpret the new dashboard and use it to coach reps effectively.
Next steps
You don’t need more data to run a successful revenue team; you need the right data. By focusing on a small set of leading indicators, you can gain a clear, accurate view of your pipeline and make proactive decisions that drive growth.
Start by reviewing your primary sales dashboard today. Identify three metrics that you rarely look at (or don’t know how to act on), and delete them. See how much clearer the picture becomes.
Ready to build dashboards that actually drive revenue? See how Brazn’s analytics platform surfaces the insights that matter.
####
Book a demo to see how Brazn AI fits into your sales stack.

About the Author

Alex Margarit, Sales AI Expert, SaaS Sales Leader, BMC, ServiceNow, Docusign — 25+ years in SaaS sales.