


Content: # Cutting Dashboard Sprawl Without Losing Insight
RevOps teams love building dashboards. But over time, this enthusiasm leads to "dashboard sprawl"—a confusing mess of conflicting reports, outdated metrics, and overwhelming data that sales leaders simply ignore.
This article provides a framework for cutting through the noise. We'll show you how to consolidate your reporting, eliminate vanity metrics, and build a streamlined dashboard ecosystem that actually drives decision-making.
What We'll Cover
In this article, we will cover:
- The dangers of dashboard sprawl
- The 'One Metric That Matters' (OMTM) framework
- How to audit and consolidate your existing reports
- Designing role-specific dashboards for Sales and Execs
Understanding the Approach
Dashboard sprawl occurs when an organization creates a new report for every minor question, resulting in hundreds of unmaintained dashboards. Cutting sprawl means shifting from "reporting everything" to "reporting what matters," ensuring that every chart directly informs a specific business decision.
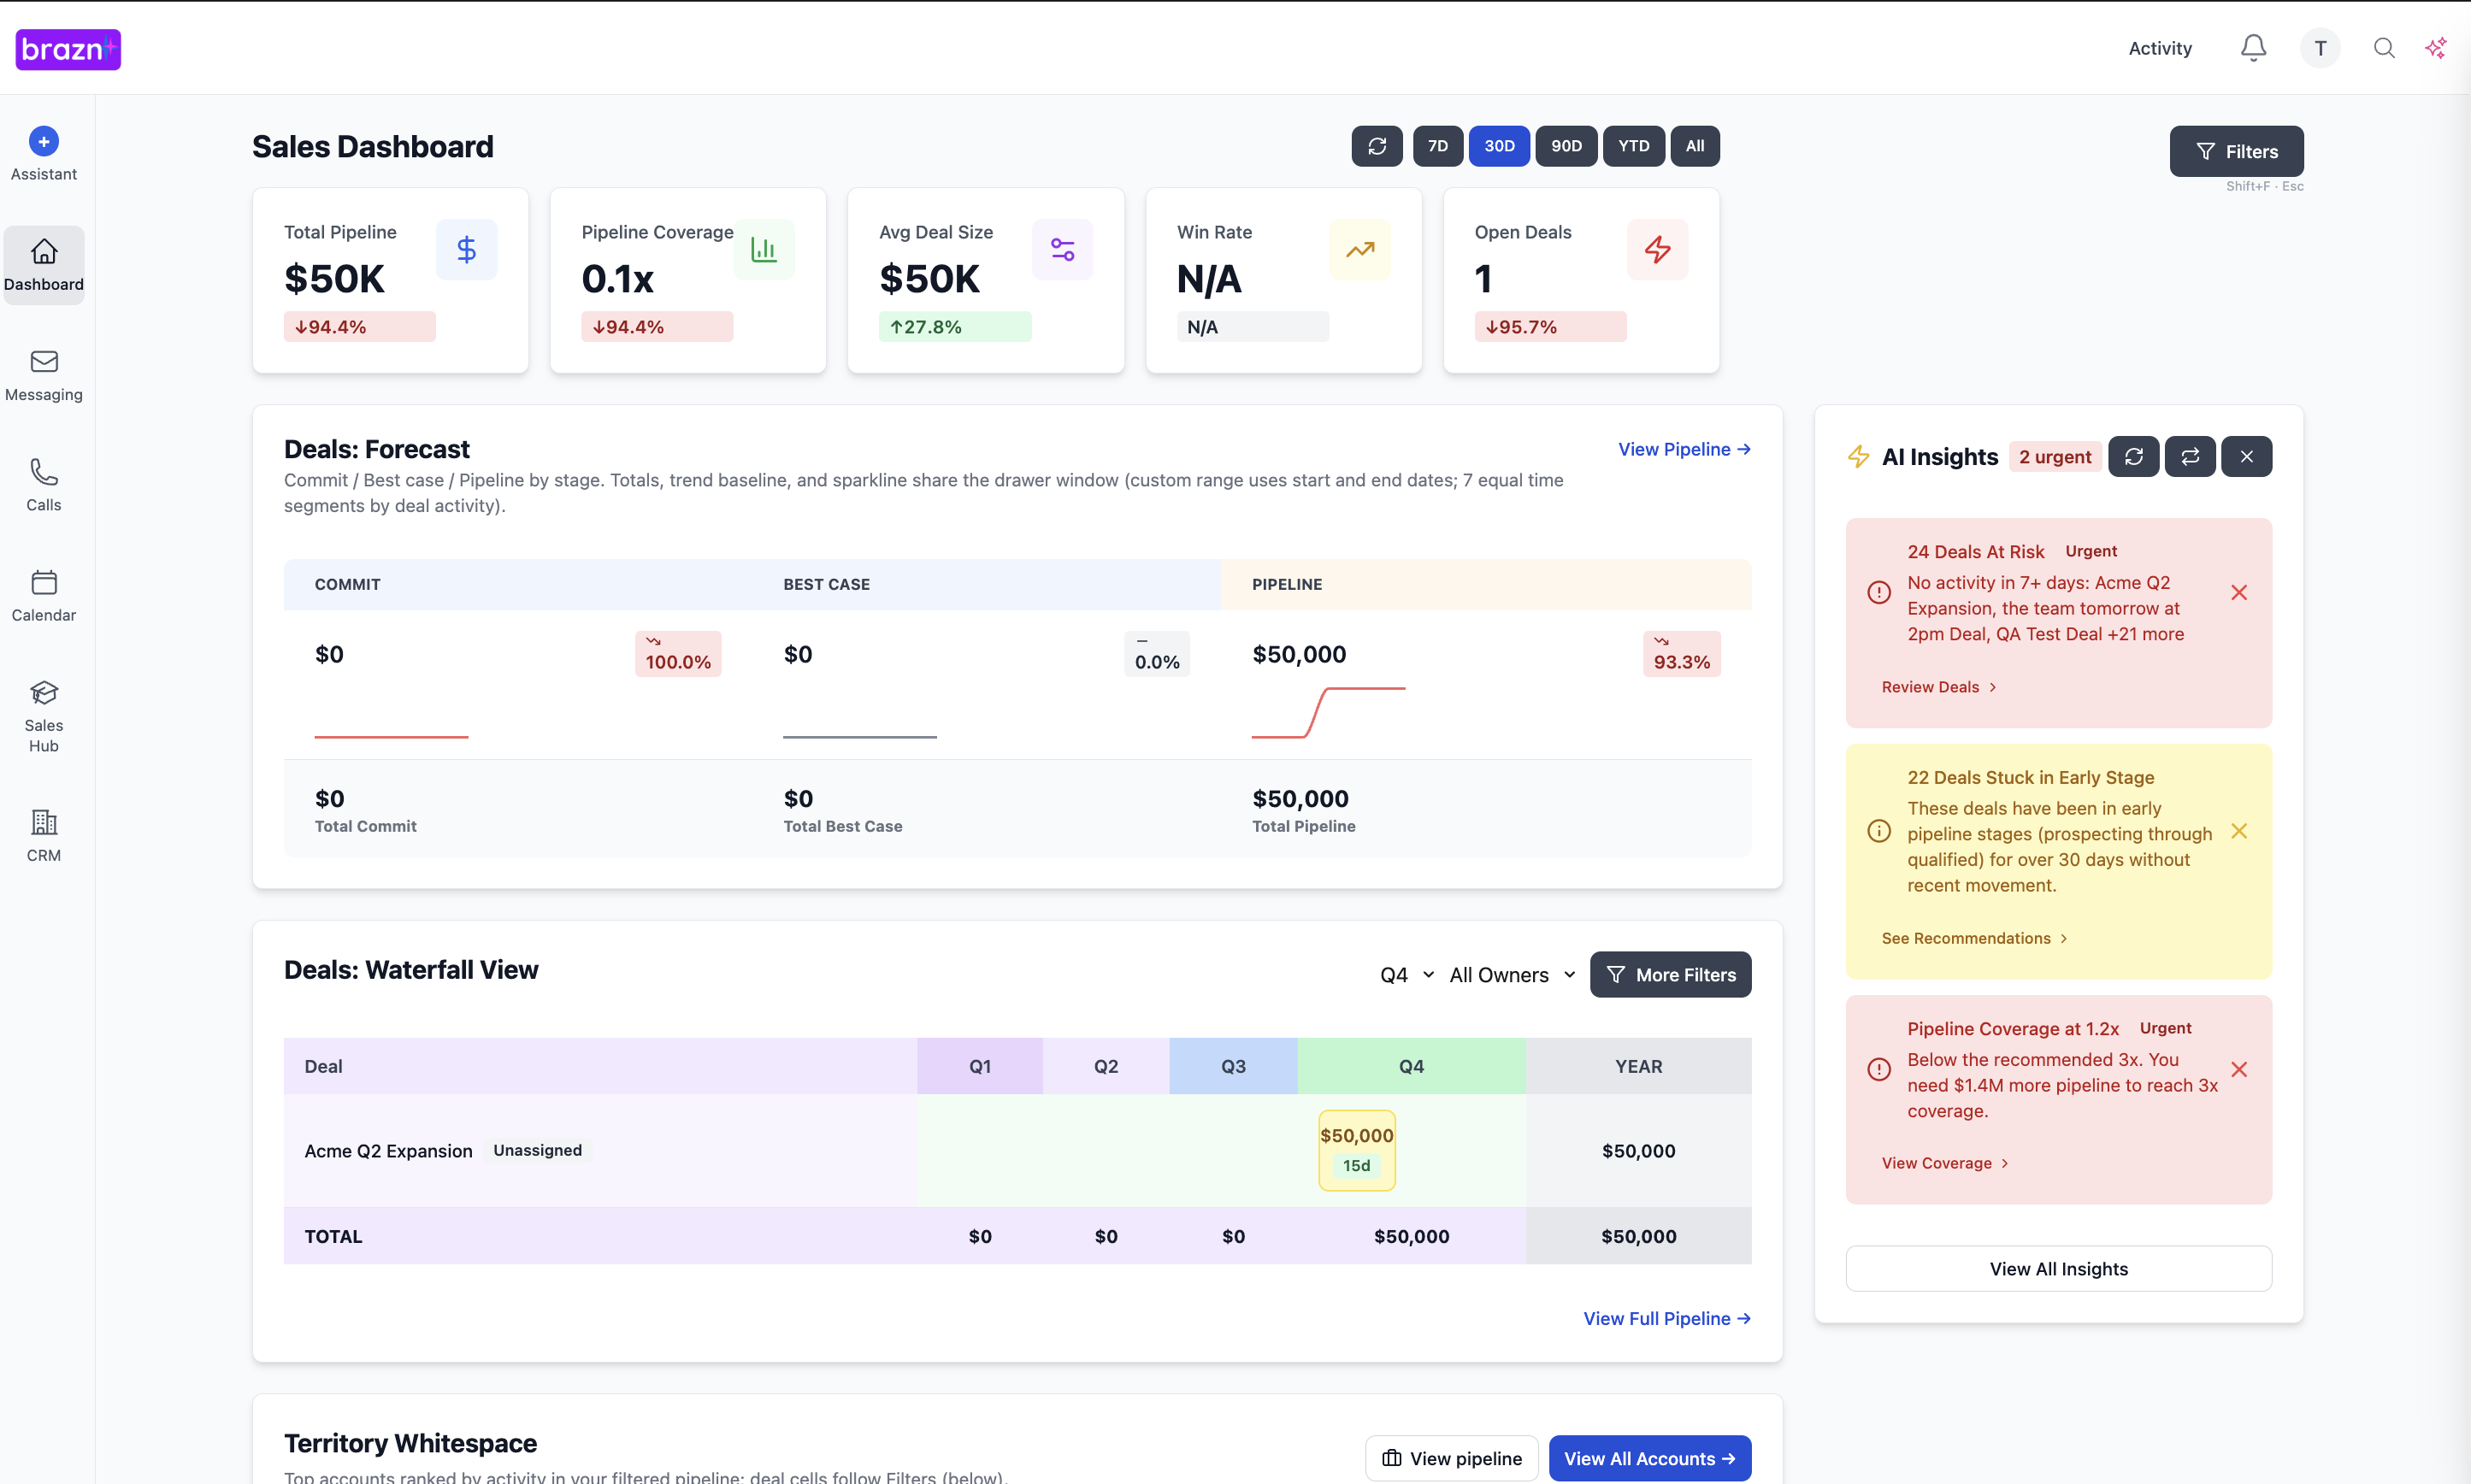
Example: A CRO doesn't need a dashboard showing the daily open rate of SDR emails. They need a single, reliable chart showing pipeline coverage for the next two quarters. The email open rate report should be archived or moved to a specific SDR manager's tactical view.
Why This Matters
Streamlining your dashboards restores trust in the data and accelerates decision-making.
- Before: Sales leaders spend hours hunting for the right data across a dozen different dashboards. After: Leaders have a single, trusted source of truth for their key metrics.
- Before: Teams argue over conflicting numbers because they're looking at different reports. After: Everyone is aligned around a consolidated set of validated metrics.
The Complete Guide
Step 1: Conduct a Dashboard Audit
Objective: Identify which reports are actually being used.
Actionable Advice: Use your CRM or BI tool's usage analytics to see which dashboards haven't been viewed in the last 60 days.
Best Practices: Be ruthless. If a dashboard isn't being used, archive it immediately.
Step 2: Define Role-Specific Views
Objective: Ensure each role only sees the data relevant to their job.
Actionable Advice: Create distinct dashboard tiers: an Executive view (high-level revenue, pipeline), a Manager view (team performance, deal risk), and a Rep view (daily activities, active deals).
Best Practices: Do not force reps to look at executive-level metrics, and vice versa.
Step 3: Enforce the 'So What?' Rule
Objective: Eliminate vanity metrics from your core reports.
Actionable Advice: For every chart on a dashboard, ask "So what?" If the data goes up or down, what specific action will be taken? If there is no clear action, remove the chart.
Best Practices: Replace static charts with actionable lists (e.g., instead of a pie chart of 'Deals by Stage', provide a list of 'Deals Stuck in Stage > 14 Days').
How to Implement This
RevOps must take ownership of the dashboard ecosystem, acting as the gatekeeper for new report requests. They must conduct regular audits and ensure data accuracy. Sales Leadership must commit to using the consolidated dashboards as their single source of truth, refusing to accept offline spreadsheets or ad-hoc reports.
Next Steps
More data doesn't equal more insight. By cutting dashboard sprawl, you empower your team to focus on the metrics that actually drive revenue, rather than drowning in a sea of irrelevant charts.
Schedule a 30-minute meeting with RevOps this week to review your primary dashboard. Identify three charts you never look at and ask to have them removed. Ready to streamline your revenue operations? Discover how Brazn can help.
Cutting Dashboard Sprawl Without Losing Insight
RevOps teams love building dashboards. But over time, this enthusiasm leads to "dashboard sprawl"—a confusing mess of conflicting reports, outdated metrics, and overwhelming data that sales leaders simply ignore.This article provides a framework for cutting through the noise. We'll show you how to consolidate your reporting, eliminate vanity metrics, and build a streamlined dashboard ecosystem that actually drives decision-making for SaaS teams.
What We'll Cover
In this article, we will cover:
- The dangers of dashboard sprawl
- The 'One Metric That Matters' (OMTM) framework
- How to audit and consolidate your existing reports
- Designing role-specific dashboards for Sales and Execs
Understanding the Approach
Dashboard sprawl occurs when an organization creates a new report for every minor question, resulting in hundreds of unmaintained dashboards. Cutting sprawl means shifting from "reporting everything" to "reporting what matters," ensuring that every chart directly informs a specific business decision.
Example: A CRO doesn't need a dashboard showing the daily open rate of SDR emails. They need a single, reliable chart showing Sales Pipeline coverage for the next two quarters. The email open rate report should be archived or moved to a specific SDR manager's tactical view.
Why This Matters
Streamlining your dashboards restores trust in the data and accelerates decision-making.
- Before: Sales leaders spend hours hunting for the right data across a dozen different dashboards. After: Leaders have a single, trusted source of truth for their key metrics.
- Before: Teams argue over conflicting numbers because they're looking at different reports. After: Everyone is aligned around a consolidated set of validated metrics.
The Complete Guide
Step 1: Conduct a Dashboard Audit
Objective: Identify which reports are actually being used.
Actionable Advice: Use your CRM or BI tool's usage analytics to see which dashboards haven't been viewed in the last 60 days.
Best Practices: Be ruthless. If a dashboard isn't being used, archive it immediately.
Step 2: Define Role-Specific Views
Objective: Ensure each role only sees the data relevant to their job.
Actionable Advice: Create distinct dashboard tiers: an Executive view (high-level revenue, pipeline), a Manager view (team performance, deal risk), and a Rep view (daily activities, active deals).
Best Practices: Do not force reps to look at executive-level metrics, and vice versa.
Step 3: Enforce the 'So What?' Rule
Objective: Eliminate vanity metrics from your core reports.
Actionable Advice: For every chart on a dashboard, ask "So what?" If the data goes up or down, what specific action will be taken? If there is no clear action, remove the chart.
Best Practices: Replace static charts with actionable lists (e.g., instead of a pie chart of 'Deals by Stage', provide a list of 'Deals Stuck in Stage > 14 Days').
How to Implement This
RevOps must take ownership of the dashboard ecosystem, acting as the gatekeeper for new report requests. They must conduct regular audits and ensure data accuracy. Sales Leadership must commit to using the consolidated dashboards as their single source of truth, refusing to accept offline spreadsheets or ad-hoc reports.
Next Steps
More data doesn't equal more insight. By cutting dashboard sprawl, you empower your team to focus on the metrics that actually drive revenue, rather than drowning in a sea of irrelevant charts.
Schedule a 30-minute meeting with RevOps this week to review your primary dashboard. Identify three charts you never look at and ask to have them removed. Ready to streamline your revenue operations? Discover how Brazn can help.
---
####
Book a demo to see how Brazn AI fits into your sales stack.

About the Author

Alex Margarit, Sales AI Expert, SaaS Sales Leader, BMC, ServiceNow, Docusign — 25+ years in SaaS sales.