

Content: # Five Numbers That Predict Whether You’ll Hit the Number
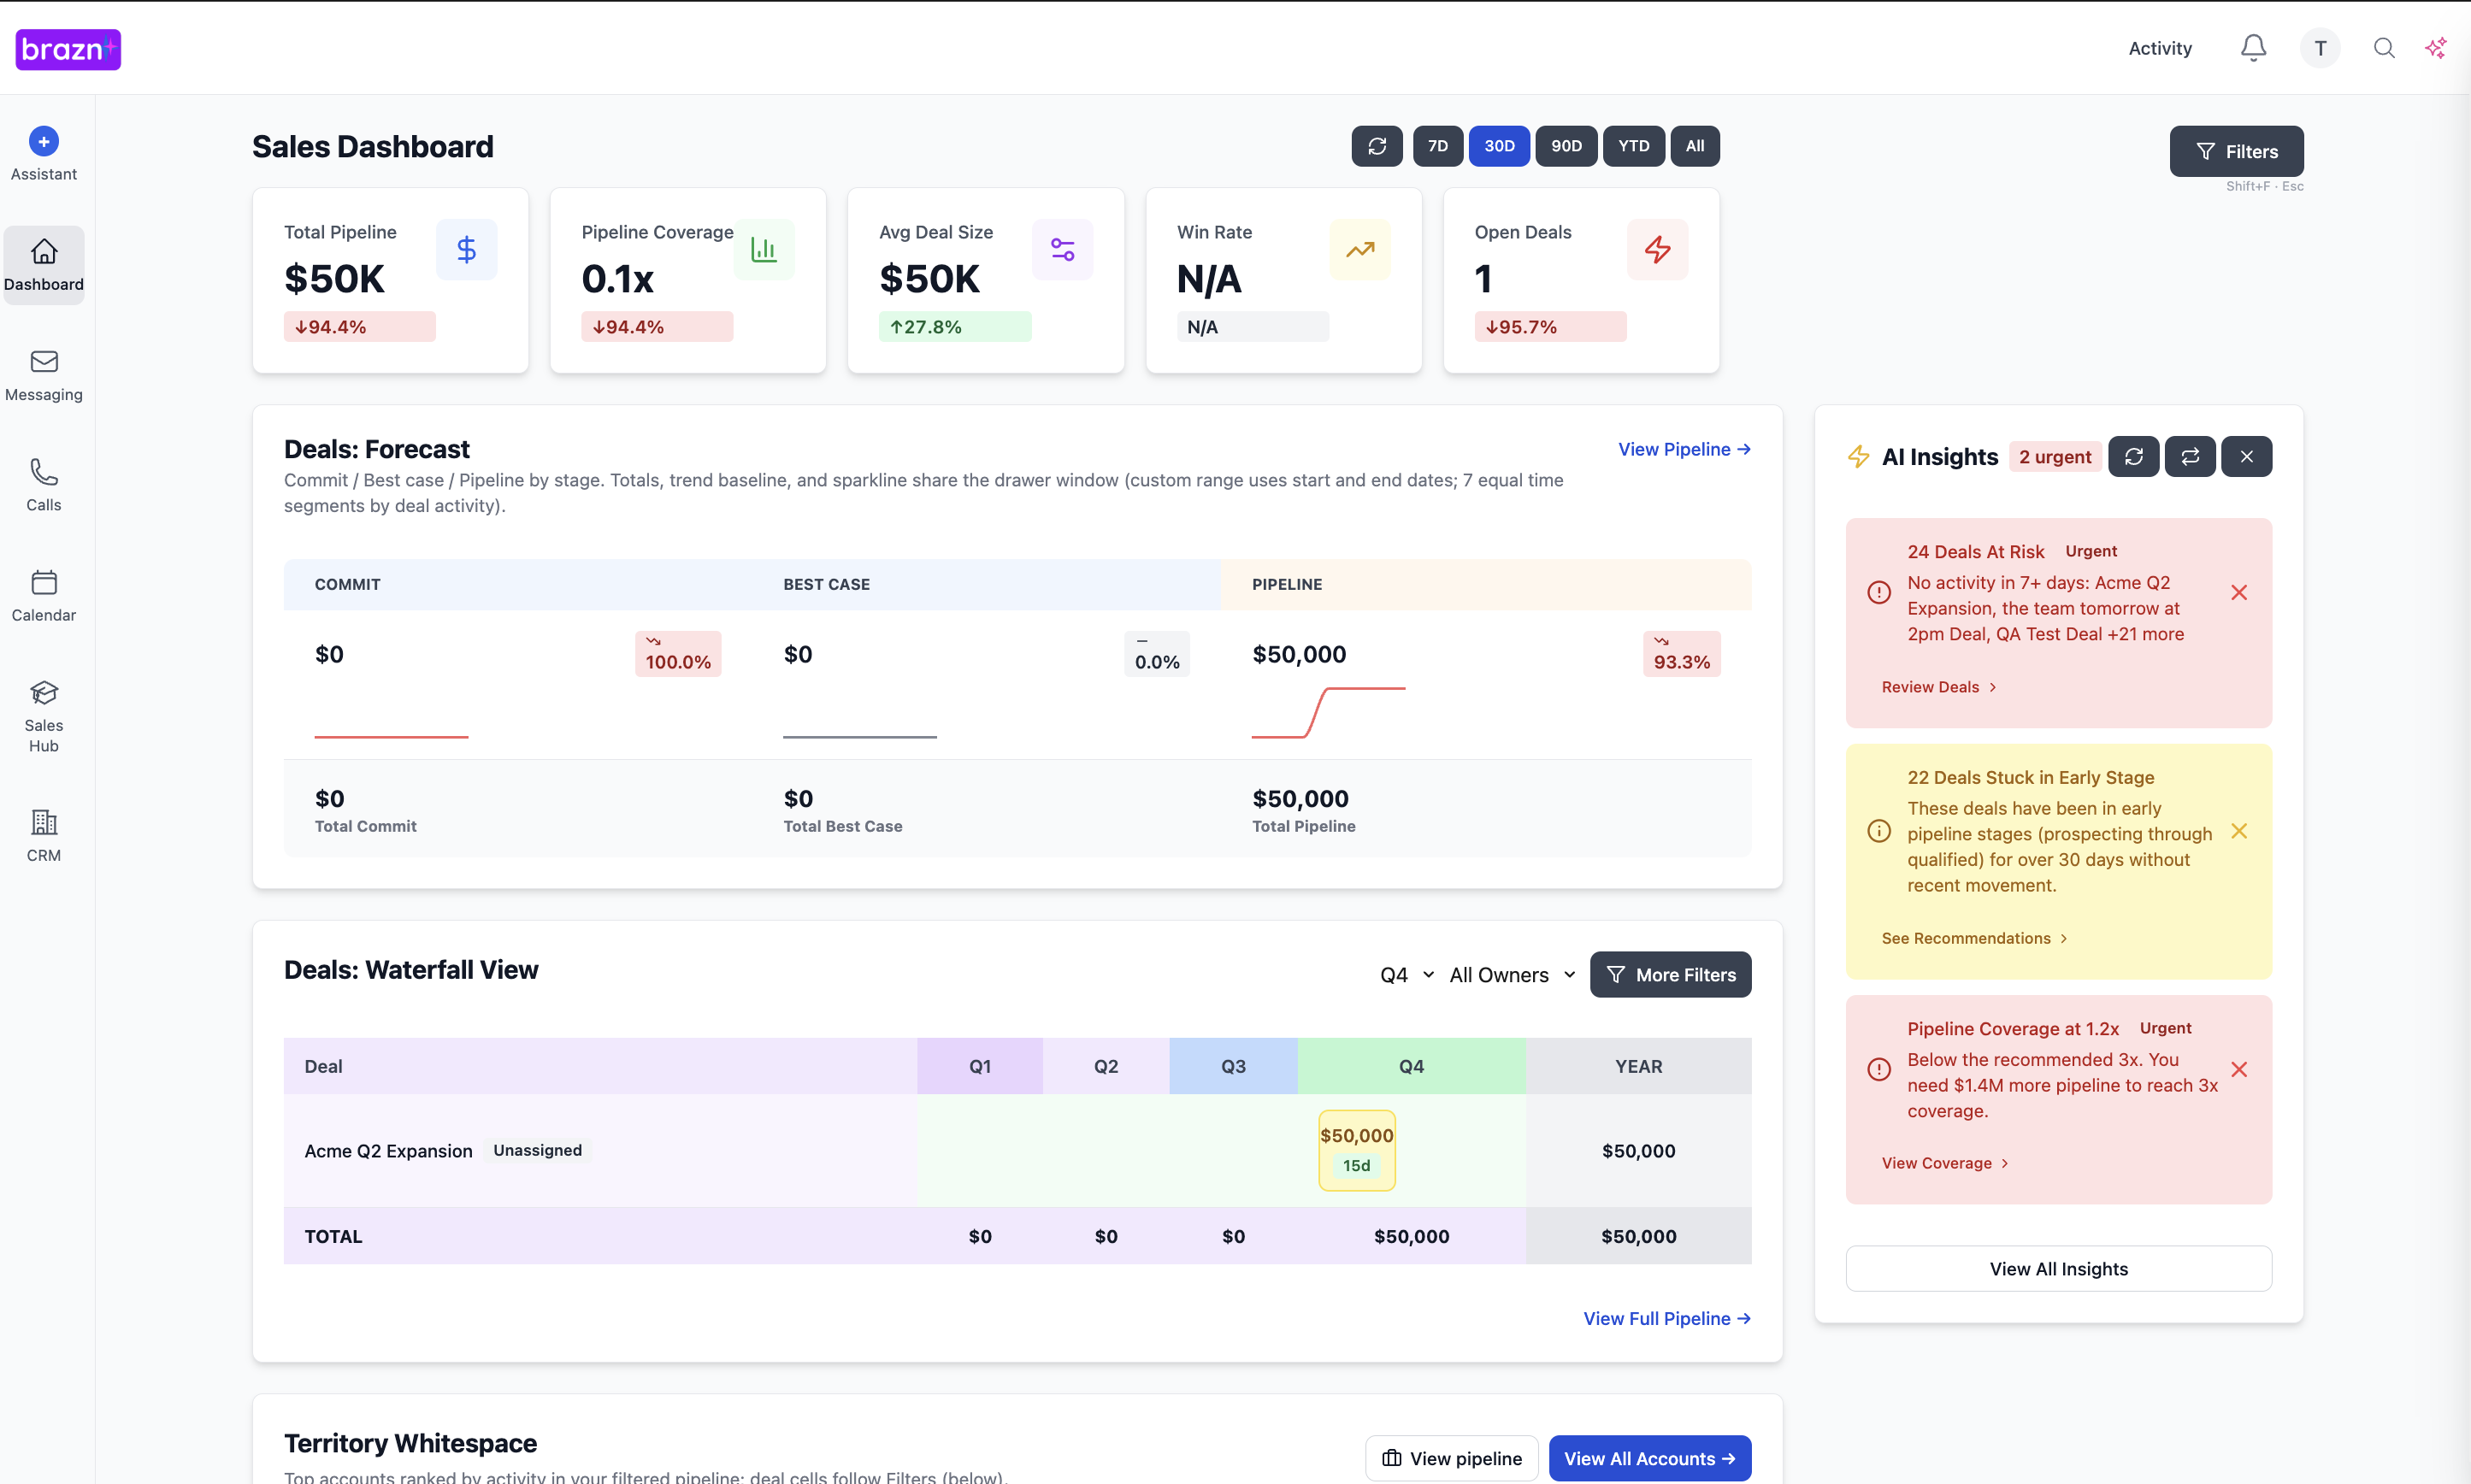
Every revenue leader knows the anxiety of the final weeks of a quarter. You stare at the CRM dashboard, looking at the total pipeline and the closed-won revenue, trying to guess if the team will actually hit the target. The problem? "Total Pipeline" is a lagging indicator; it tells you what happened, not what will happen.
Relying on lagging indicators is like driving a car while looking only in the rearview mirror. To accurately predict the future and proactively manage the business, leaders must focus on leading indicators—the specific metrics that signal the health and velocity of the revenue engine.
This article cuts through the noise of complex dashboards to identify the 5 critical numbers that actually predict whether you will hit your revenue targets. By tracking these metrics, you can shift from reactive guessing to proactive forecasting.
What We'll Cover
In this article, we will cover:
- The danger of relying on "Total Pipeline"
- The difference between leading and lagging indicators
- 5 predictive metrics every revenue leader must track
- How to calculate and interpret these numbers
- Using these metrics to drive proactive coaching
Understanding the Approach
A predictive metric (or leading indicator) is a measurable data point that changes before the final outcome (closed-won revenue) is realized. In RevOps, these metrics measure the efficiency and momentum of the sales process, allowing leaders to intervene while there is still time to affect the result.
Example: "Meetings Booked" is a leading indicator; "Deals Closed" is a lagging indicator. If the number of first meetings booked drops significantly in week 2 of the quarter, a leader knows immediately that there will be a pipeline shortage in week 8, giving them time to adjust the marketing spend or outbound strategy.
Why This Matters
Tracking these five predictive numbers gives leaders the visibility needed to manage the business predictably and avoid end-of-quarter surprises.
- Before: Forecasts fluctuate wildly based on rep optimism, leading to missed targets and lost credibility with the board. After: Forecasts are grounded in mathematical realities, ensuring consistent accuracy.
- Before: Managers discover a pipeline problem in the last month of the quarter, when it's too late to fix it. After: Managers spot early warning signs in the leading indicators and adjust tactics immediately.
- Before: Coaching is generic and focused on effort ("make more calls"). After: Coaching is targeted based on specific conversion bottlenecks ("let's work on your demo-to-proposal conversion").
The Complete Guide
Number 1: Pipeline Generation Velocity (PGV)
Objective: Ensure you're creating enough new pipeline to sustain future growth.
Calculation: Total value of new qualified opportunities created in a specific period (e.g., weekly).
Why it predicts: If your PGV drops below the required threshold (usually 3-4x your quota requirement), you're mathematically guaranteed to miss your future targets, regardless of your win rate.
Number 2: Stage-to-Stage Conversion Rates
Objective: Identify exactly where deals are falling out of the funnel.
Calculation: The percentage of opportunities that move from one specific stage (e.g., Discovery) to the next (e.g., Demo).
Why it predicts: A sudden drop in the Discovery-to-Demo conversion rate indicates a problem with qualification or initial messaging. Fixing this bottleneck immediately improves the yield of the entire pipeline.
Number 3: Average Sales Cycle Length (by Segment)
Objective: Know when a deal is likely to close, or when it's stalling.
Calculation: The average number of days it takes an opportunity to move from creation to closed-won.
Why it predicts: If your average sales cycle is 60 days, and a rep commits a deal that was created 20 days ago, the forecast is highly risky. Tracking this allows you to challenge unrealistic close dates.
Number 4: The "Slipped Deal" Ratio
Objective: Measure the accuracy of your team's forecasting and deal management.
Calculation: The percentage of deals forecasted to close in a specific period that are pushed to the next period.
Why it predicts: A high slipped deal ratio indicates poor qualification, a lack of compelling events, or "happy ears." It means your current pipeline is artificially inflated.
Number 5: Customer Acquisition Cost (CAC) Payback Period
Objective: Ensure your growth is financially sustainable.
Calculation: The number of months it takes for the gross margin from a new customer to cover the cost of acquiring them.
Why it predicts: While often viewed as a finance metric, CAC Payback is critical for RevOps. If the payback period is stretching too long, it means your sales motion is too expensive or your discounting is too deep, threatening long-term viability.
How to Implement This
RevOps must build the dashboards that surface these five numbers clearly and accurately, ensuring the underlying CRM data is clean. Sales leadership must shift their management cadence to focus on these metrics. Instead of asking "What's closing this week?" they should ask "Why did our Discovery conversion rate drop last week?" Enablement should use these metrics to identify training gaps and deploy targeted coaching.
Next Steps
Hitting your revenue target shouldn't be a surprise, and it shouldn't rely on last-minute heroics. By obsessively tracking these five predictive numbers, you can gain control over your revenue engine and forecast with confidence.
Stop looking at Total Pipeline today. Pull the data for your Stage-to-Stage Conversion Rates over the last 90 days. Find the biggest drop-off point, and make fixing that your top priority for the month. Ready to build a predictable revenue engine? See how Brazn's analytics platform automatically tracks the metrics that matter.
Five Numbers That Predict Whether You’ll Hit the Number
Every revenue leader knows the anxiety of the final weeks of a quarter. You stare at the CRM dashboard, looking at the total pipeline and the closed-won revenue, trying to guess if the team will actually hit the target. The problem? "Total Pipeline" is a lagging indicator; it tells you what happened, not what will happen.
Relying on lagging indicators is like driving a car while looking only in the rearview mirror. To accurately predict the future and proactively manage the business, leaders must focus on leading indicators—the specific metrics that signal the health and velocity of the revenue engine.
This article cuts through the noise of complex dashboards to identify the 5 critical numbers that actually predict whether you will hit your revenue targets. By tracking these metrics, you can shift from reactive guessing to proactive forecasting.
What We'll Cover
In this article, we will cover:
- The danger of relying on "Total Pipeline"
- The difference between leading and lagging indicators
- 5 predictive metrics every revenue leader must track
- How to calculate and interpret these numbers
- Using these metrics to drive proactive coaching
Understanding the Approach
A predictive metric (or leading indicator) is a measurable data point that changes before the final outcome (closed-won revenue) is realized. In RevOps, these metrics measure the efficiency and momentum of the sales process, allowing leaders to intervene while there is still time to affect the result.
Example: "Meetings Booked" is a leading indicator; "Deals Closed" is a lagging indicator. If the number of first meetings booked drops significantly in week 2 of the quarter, a leader knows immediately that there will be a pipeline shortage in week 8, giving them time to adjust the marketing spend or outbound strategy.
Why This Matters
Tracking these five predictive numbers gives leaders the visibility needed to manage the business predictably and avoid end-of-quarter surprises.
- Before: Forecasts fluctuate wildly based on rep optimism, leading to missed targets and lost credibility with the board. After: Forecasts are grounded in mathematical realities, ensuring consistent accuracy.
- Before: Managers discover a pipeline problem in the last month of the quarter, when it's too late to fix it. After: Managers spot early warning signs in the leading indicators and adjust tactics immediately.
- Before: Coaching is generic and focused on effort ("make more calls"). After: Coaching is targeted based on specific conversion bottlenecks ("let's work on your demo-to-proposal conversion").
The Complete Guide
Number 1: Pipeline Generation Velocity (PGV)
Objective: Ensure you're creating enough new pipeline to sustain future growth.
Calculation: Total value of new qualified opportunities created in a specific period (e.g., weekly).
Why it predicts: If your PGV drops below the required threshold (usually 3-4x your quota requirement), you're mathematically guaranteed to miss your future targets, regardless of your win rate.
Number 2: Stage-to-Stage Conversion Rates
Objective: Identify exactly where deals are falling out of the funnel.
Calculation: The percentage of opportunities that move from one specific stage (e.g., Discovery) to the next (e.g., Demo).
Why it predicts: A sudden drop in the Discovery-to-Demo conversion rate indicates a problem with qualification or initial messaging. Fixing this bottleneck immediately improves the yield of the entire pipeline.
Number 3: Average Sales Cycle Length (by Segment)
Objective: Know when a deal is likely to close, or when it's stalling.
Calculation: The average number of days it takes an opportunity to move from creation to closed-won.
Why it predicts: If your average sales cycle is 60 days, and a rep commits a deal that was created 20 days ago, the forecast is highly risky. Tracking this allows you to challenge unrealistic close dates.
Number 4: The "Slipped Deal" Ratio
Objective: Measure the accuracy of your team's forecasting and deal management.
Calculation: The percentage of deals forecasted to close in a specific period that are pushed to the next period.
Why it predicts: A high slipped deal ratio indicates poor qualification, a lack of compelling events, or "happy ears." It means your current pipeline is artificially inflated.
Number 5: Customer Acquisition Cost (CAC) Payback Period
Objective: Ensure your growth is financially sustainable.
Calculation: The number of months it takes for the gross margin from a new customer to cover the cost of acquiring them.
Why it predicts: While often viewed as a finance metric, CAC Payback is critical for RevOps. If the payback period is stretching too long, it means your sales motion is too expensive or your discounting is too deep, threatening long-term viability.
How to Implement This
RevOps must build the dashboards that surface these five numbers clearly and accurately, ensuring the underlying CRM data is clean. Sales leadership must shift their management cadence to focus on these metrics. Instead of asking "What's closing this week?" they should ask "Why did our Discovery conversion rate drop last week?" Enablement should use these metrics to identify training gaps and deploy targeted coaching.
Next Steps
Hitting your revenue target shouldn't be a surprise, and it shouldn't rely on last-minute heroics. By obsessively tracking these five predictive numbers, you can gain control over your revenue engine and forecast with confidence.
Stop looking at Total Pipeline today. Pull the data for your Stage-to-Stage Conversion Rates over the last 90 days. Find the biggest drop-off point, and make fixing that your top priority for the month. Ready to build a predictable revenue engine? See how Brazn's analytics platform automatically tracks the metrics that matter.
---
####
Book a demo to see how Brazn AI fits into your sales stack.

About the Author

Alex Margarit, Sales AI Expert, SaaS Sales Leader, BMC, ServiceNow, Docusign — 25+ years in SaaS sales.