

How to Build a Sales Forecast Model in SaaS
A sales forecast model translates the current state of your pipeline into a prediction of revenue in a defined future period. Done well, it gives the CEO, board, and finance team a reliable basis for resource allocation, hiring decisions, and investor communication. Done poorly, it's an optimism aggregator that produces a number nobody trusts and everyone spends the last week of the quarter scrambling to rescue.
The difference between a reliable forecast model and an unreliable one is almost always in the inputs — not the spreadsheet design or the BI tool. A sophisticated model fed by subjective, self-reported data produces a sophisticated-looking wrong answer.
The Three Types of SaaS Forecast Models
1. Stage-weighted modelEach pipeline stage is assigned a probability of closing in the current period. Total forecast = sum of (deal value × stage probability) across all open deals. Simple to build, widely used, and systemically wrong for most teams — because stage advancement is often based on rep activity rather than buyer progress, and stage probabilities don't account for individual deal quality.
Use when: team is very early stage, no historical data exists, and something is better than nothing.
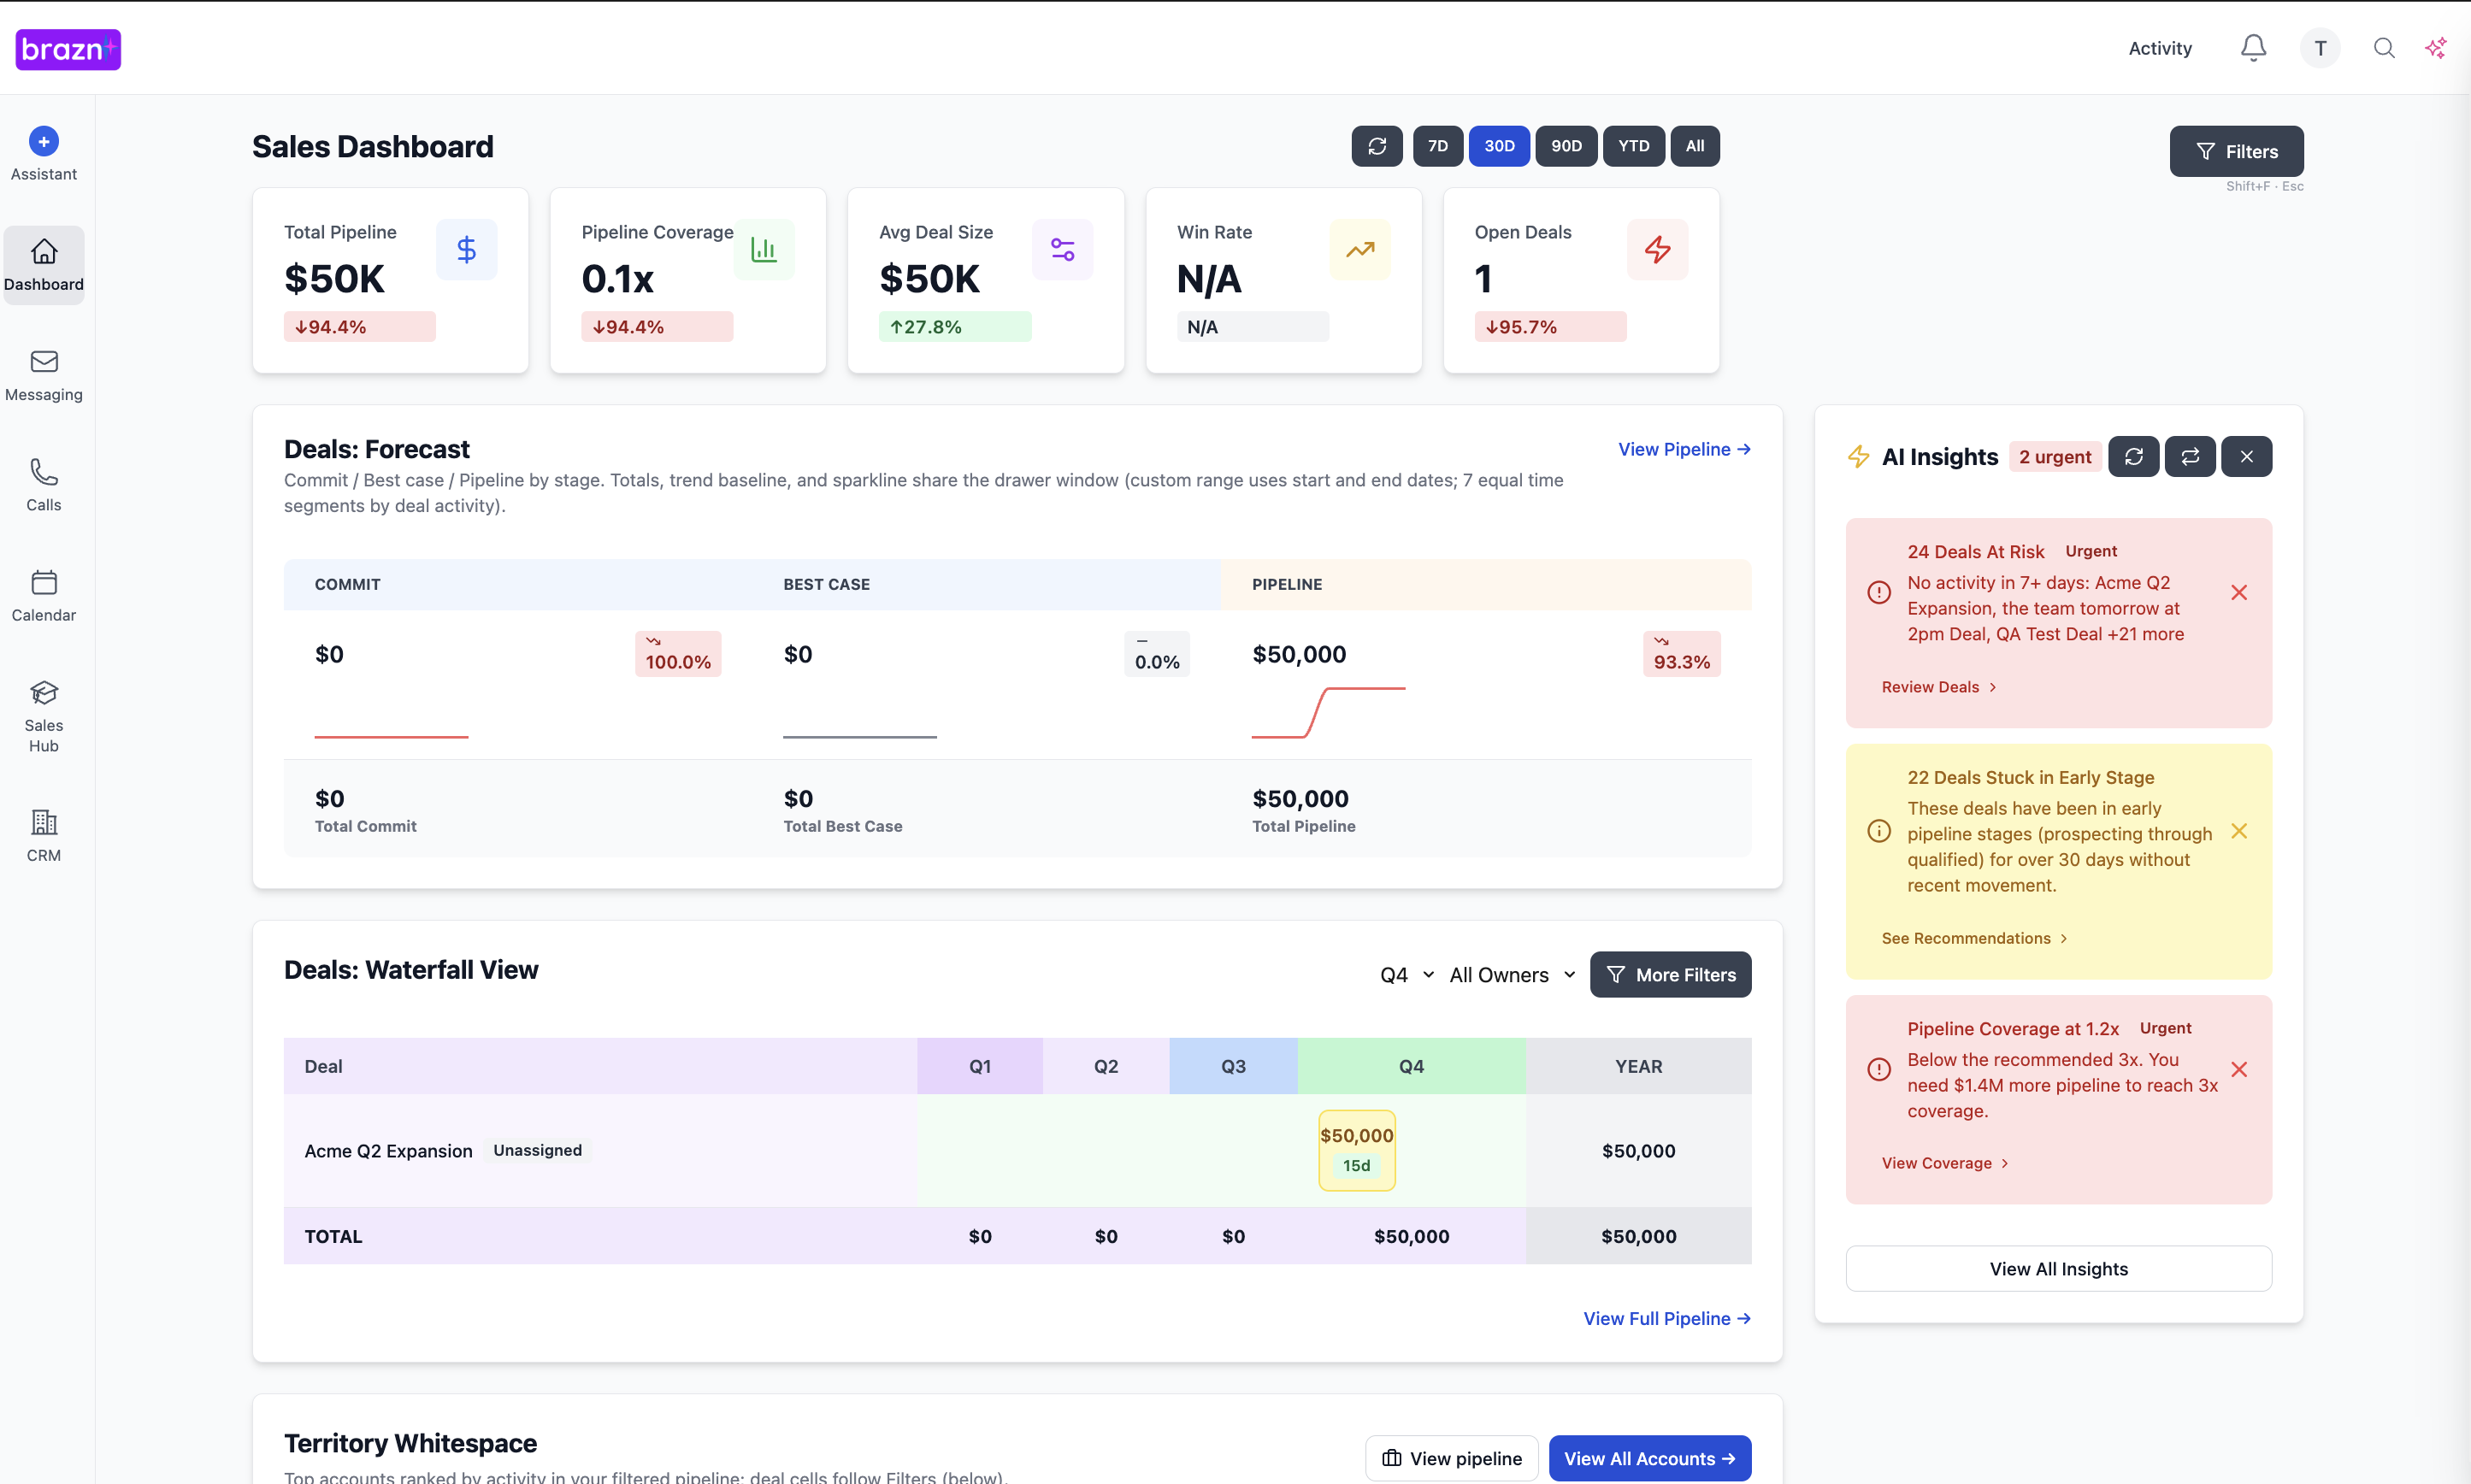
2. Category-based model (Commit / Best Case / Pipeline)Reps assign deals to forecast categories based on their assessment of close confidence. Each category is given a probability multiplier derived from historical close rates for that category. Forecast = Commit × historical commit close rate + Best Case × historical best case close rate.
Better than stage-weighted because it incorporates rep judgment — but still vulnerable to commit inflation and optimism bias.
Use when: team has 3+ quarters of historical data to calibrate category close rates.
3. AI signal-based modelDeals are scored by AI based on objective qualification signals — MEDDPICC completeness, engagement patterns, deal velocity, stakeholder coverage — and the forecast is built from AI scores rather than (or in addition to) rep self-reporting. Historical calibration of AI scores against outcomes produces probability estimates that are systematically more accurate than category-based models.
Use when: team has an AI deal intelligence tool (Brazn) and 2+ quarters of deal outcome data to calibrate against.
The most robust forecast combines all three: category-based as the rep-facing input, AI signal-based as the objective check, and stage-weighted as the trailing indicator for pipeline coverage.
Building the Model: Step by Step
Step 1: Define the period and currencyThe model should cover a defined period — typically the current quarter, with a 12-month rolling view. All deals should be denominated in the same currency with exchange rate conventions documented for international teams.
Step 2: Build the pipeline data foundationThe model is only as good as the underlying pipeline data. Required fields for each deal in the model:
Deal name and company
AE owner
Deal value (ACV or TCV — define once and apply consistently)
Current stage
Close date
Forecast category (Commit / Best Case / Pipeline / Omitted)
AI deal score (from Brazn)
MEDDPICC completeness score
Days in current stage
Last meaningful interaction date
Key risk flags
This data should be pulled directly from CRM — not entered manually into a spreadsheet — to ensure currency and eliminate transcription error.
Step 3: Calculate historical category close ratesPull the last 6–8 quarters of closed data. For each quarter, calculate:
What percentage of Commit deals closed in-period?
What percentage of Best Case deals closed in-period?
What was the average slip rate (deals forecast to close that moved to the next period)?
These become your probability multipliers. Example:
Commit: historically closes at 74% in-period
Best Case: historically closes at 31% in-period
Pipeline: historically closes at 8% in-period
Step 4: Build the category-based forecast calculationtextCommit forecast = Σ(Commit deals) × 0.74
Best Case forecast = Σ(Best Case deals) × 0.31
Pipeline contribution = Σ(Pipeline deals in period) × 0.08
Total forecast = Commit forecast + Best Case forecast + Pipeline contribution
This is your baseline. It reflects historical patterns applied to the current pipeline.
Step 5: Apply AI score overlayFor every Commit and Best Case deal, pull the AI qualification score from Brazn. Build a second calculation:
textAI-weighted forecast = Σ(Deal value × AI close probability) for all in-period deals
Where AI close probability is derived from the historical correlation between Brazn's qualification scores and actual close rates — calibrated over prior quarters.
Compare AI-weighted forecast against category-based forecast. The gap between them is the intelligence signal: deals where rep confidence exceeds AI score are the ones to inspect.
Step 6: Scenario analysisBuild three scenarios:
| Scenario | Methodology |
| --- | --- |
| Conservative | Commit × 0.74 only — Best Case excluded entirely |
| Base | Full category-based calculation |
| Upside | Commit at 100% + Best Case × 1.3× historical rate (best quarter performance) |
The range between conservative and upside is your confidence interval. Present all three to the board with the specific deals that drive the difference.
Step 7: Deal-level narrative for top moversIdentify the 5–10 deals whose close or slip most determines whether the period hits. For each, write a four-line status note:
Current state: where the deal is and what the most recent interaction was.
Close plan: the specific actions required to get from current state to signed.
Risk: the specific thing most likely to prevent in-period close.
Mitigation: what is being done about that risk.
Maintaining the Model Through the Quarter
A forecast model that is built once at the start of the quarter and not updated is a snapshot, not a forecast. The model should be refreshed weekly:
Pull fresh CRM data including all stage changes, close date moves, and new deals added.
Update AI scores from Brazn after the week's calls are processed.
Review category changes — any deal that moved from Commit to Best Case or was omitted needs a manager explanation.
Recalculate all three scenarios.
Update top deal narratives for deals that have had material interactions.
The week-over-week delta — specifically which deals have moved categories and why — is the most important input for the CRO's board update.
Common Model Failures and How to Fix Them
Problem: Commit keeps shrinking as the quarter progresses.Cause: commit inflation early in the quarter — deals are committed before they're qualified.
Fix: require MEDDPICC minimum score (e.g., 60%+) and EB engagement as prerequisites for Commit classification.
Problem: The AI forecast and the category forecast diverge by more than 20%.Cause: reps are systematically over-committing relative to qualification evidence.
Fix: review every deal where the gap is >30%. Use Brazn's qualification data to identify which specific MEDDPICC gaps are driving the divergence.
Problem: Close dates are unreliable — deals consistently slip.Cause: close dates are aspirational rather than evidence-based.
Fix: require a mutual action plan with prospect-confirmed close date before any deal can be placed in Commit.
Problem: The model is accurate on average but wrong on individual deals.Cause: probability multipliers average out errors rather than identifying deal-specific risk.
Fix: use deal-level AI scores rather than category-level multipliers for deals above a certain size threshold.
How Brazn Powers the Model
Brazn provides the deal-level qualification scores that replace the weakest link in the forecast chain — rep self-assessment. By pulling MEDDPICC completeness and AI deal probability directly from Brazn into the forecast model, the calculation is grounded in objective qualification evidence. For CROs who have been surprised by late-stage losses on committed deals, this is the specific problem Brazn solves.
---
####
Book a demo to see how Brazn AI fits into your sales stack.

About the Author

Alex Margarit, Sales AI Expert, SaaS Sales Leader, BMC, ServiceNow, Docusign — 25+ years in SaaS sales.