


The Nine GTM KPIs That Actually Reveal Strategy Health
Revenue leaders are drowning in data. Dashboards are cluttered with dozens of metrics—email open rates, website traffic, MQLs—that look impressive but offer little strategic value. When you track everything, you track nothing. This "metric bloat" makes it impossible to quickly assess the true health of your Go-to-Market strategy, leading to reactive decision-making.
The solution isn't more data; it's the right data. To truly understand if your GTM engine is working, you need to focus on a small set of high-signal key performance indicators. This article cuts through the noise and reveals the 9 essential KPIs that top RevOps leaders use to measure the health of their revenue strategy.
What We'll Cover
In this article, we will cover:
- Why "vanity metrics" distract from true revenue growth
- The difference between leading and lagging indicators
- 3 KPIs for top-of-funnel health (Demand Generation)
- 3 KPIs for middle-of-funnel efficiency (Sales Execution)
- 3 KPIs for bottom-of-funnel success (Customer Expansion)
Understanding the Approach
A "Strategic KPI" is a metric that directly correlates with the long-term success of the business model, rather than just measuring a localized activity. In B2B SaaS, this means moving away from measuring effort (e.g., number of cold calls made) and focusing on measuring efficiency and conversion across the entire customer lifecycle (e.g., Customer Acquisition Cost Payback Period).
Example: A vanity metric is "1,000 new MQLs this month." A strategic KPI is "Marketing Sourced Pipeline Conversion Rate." The latter tells you not just that marketing is busy, but whether their activity is actually generating revenue-ready opportunities that the sales team can close.
Why This Matters
Focusing on these 9 KPIs aligns the entire organization around the metrics that actually matter to the board and investors.
- Before: Marketing celebrates high lead volume while Sales complains about lead quality, creating friction. After: Both teams are aligned around shared conversion metrics, ensuring high-quality pipeline generation.
- Before: The CRO is surprised by a missed revenue target at the end of the quarter. After: The CRO monitors leading indicators, identifying pipeline risks weeks before they impact revenue.
- Before: Customer Success is viewed as a cost center focused on support tickets. After: CS is measured on Net Revenue Retention, transforming them into a revenue-generating engine.
The Complete Guide
H3 Demand Generation (Top-of-Funnel)
1. Customer Acquisition Cost (CAC) Payback Period: The number of months it takes to earn back the cost of acquiring a new customer. This is the ultimate measure of GTM efficiency.
2. Marketing Sourced Pipeline Conversion Rate: The percentage of marketing-generated leads that convert into actual sales opportunities.
3. Sales Qualified Lead (SQL) Velocity: The speed at which a lead moves from initial inquiry to a qualified opportunity.
H3 Sales Execution (Middle-of-Funnel)
1. Win Rate by Stage: The percentage of deals that progress from one specific stage to the next (e.g., Discovery to Proposal). This highlights exactly where deals are getting stuck.
2. Average Sales Cycle Length: The average number of days it takes to close a won deal.
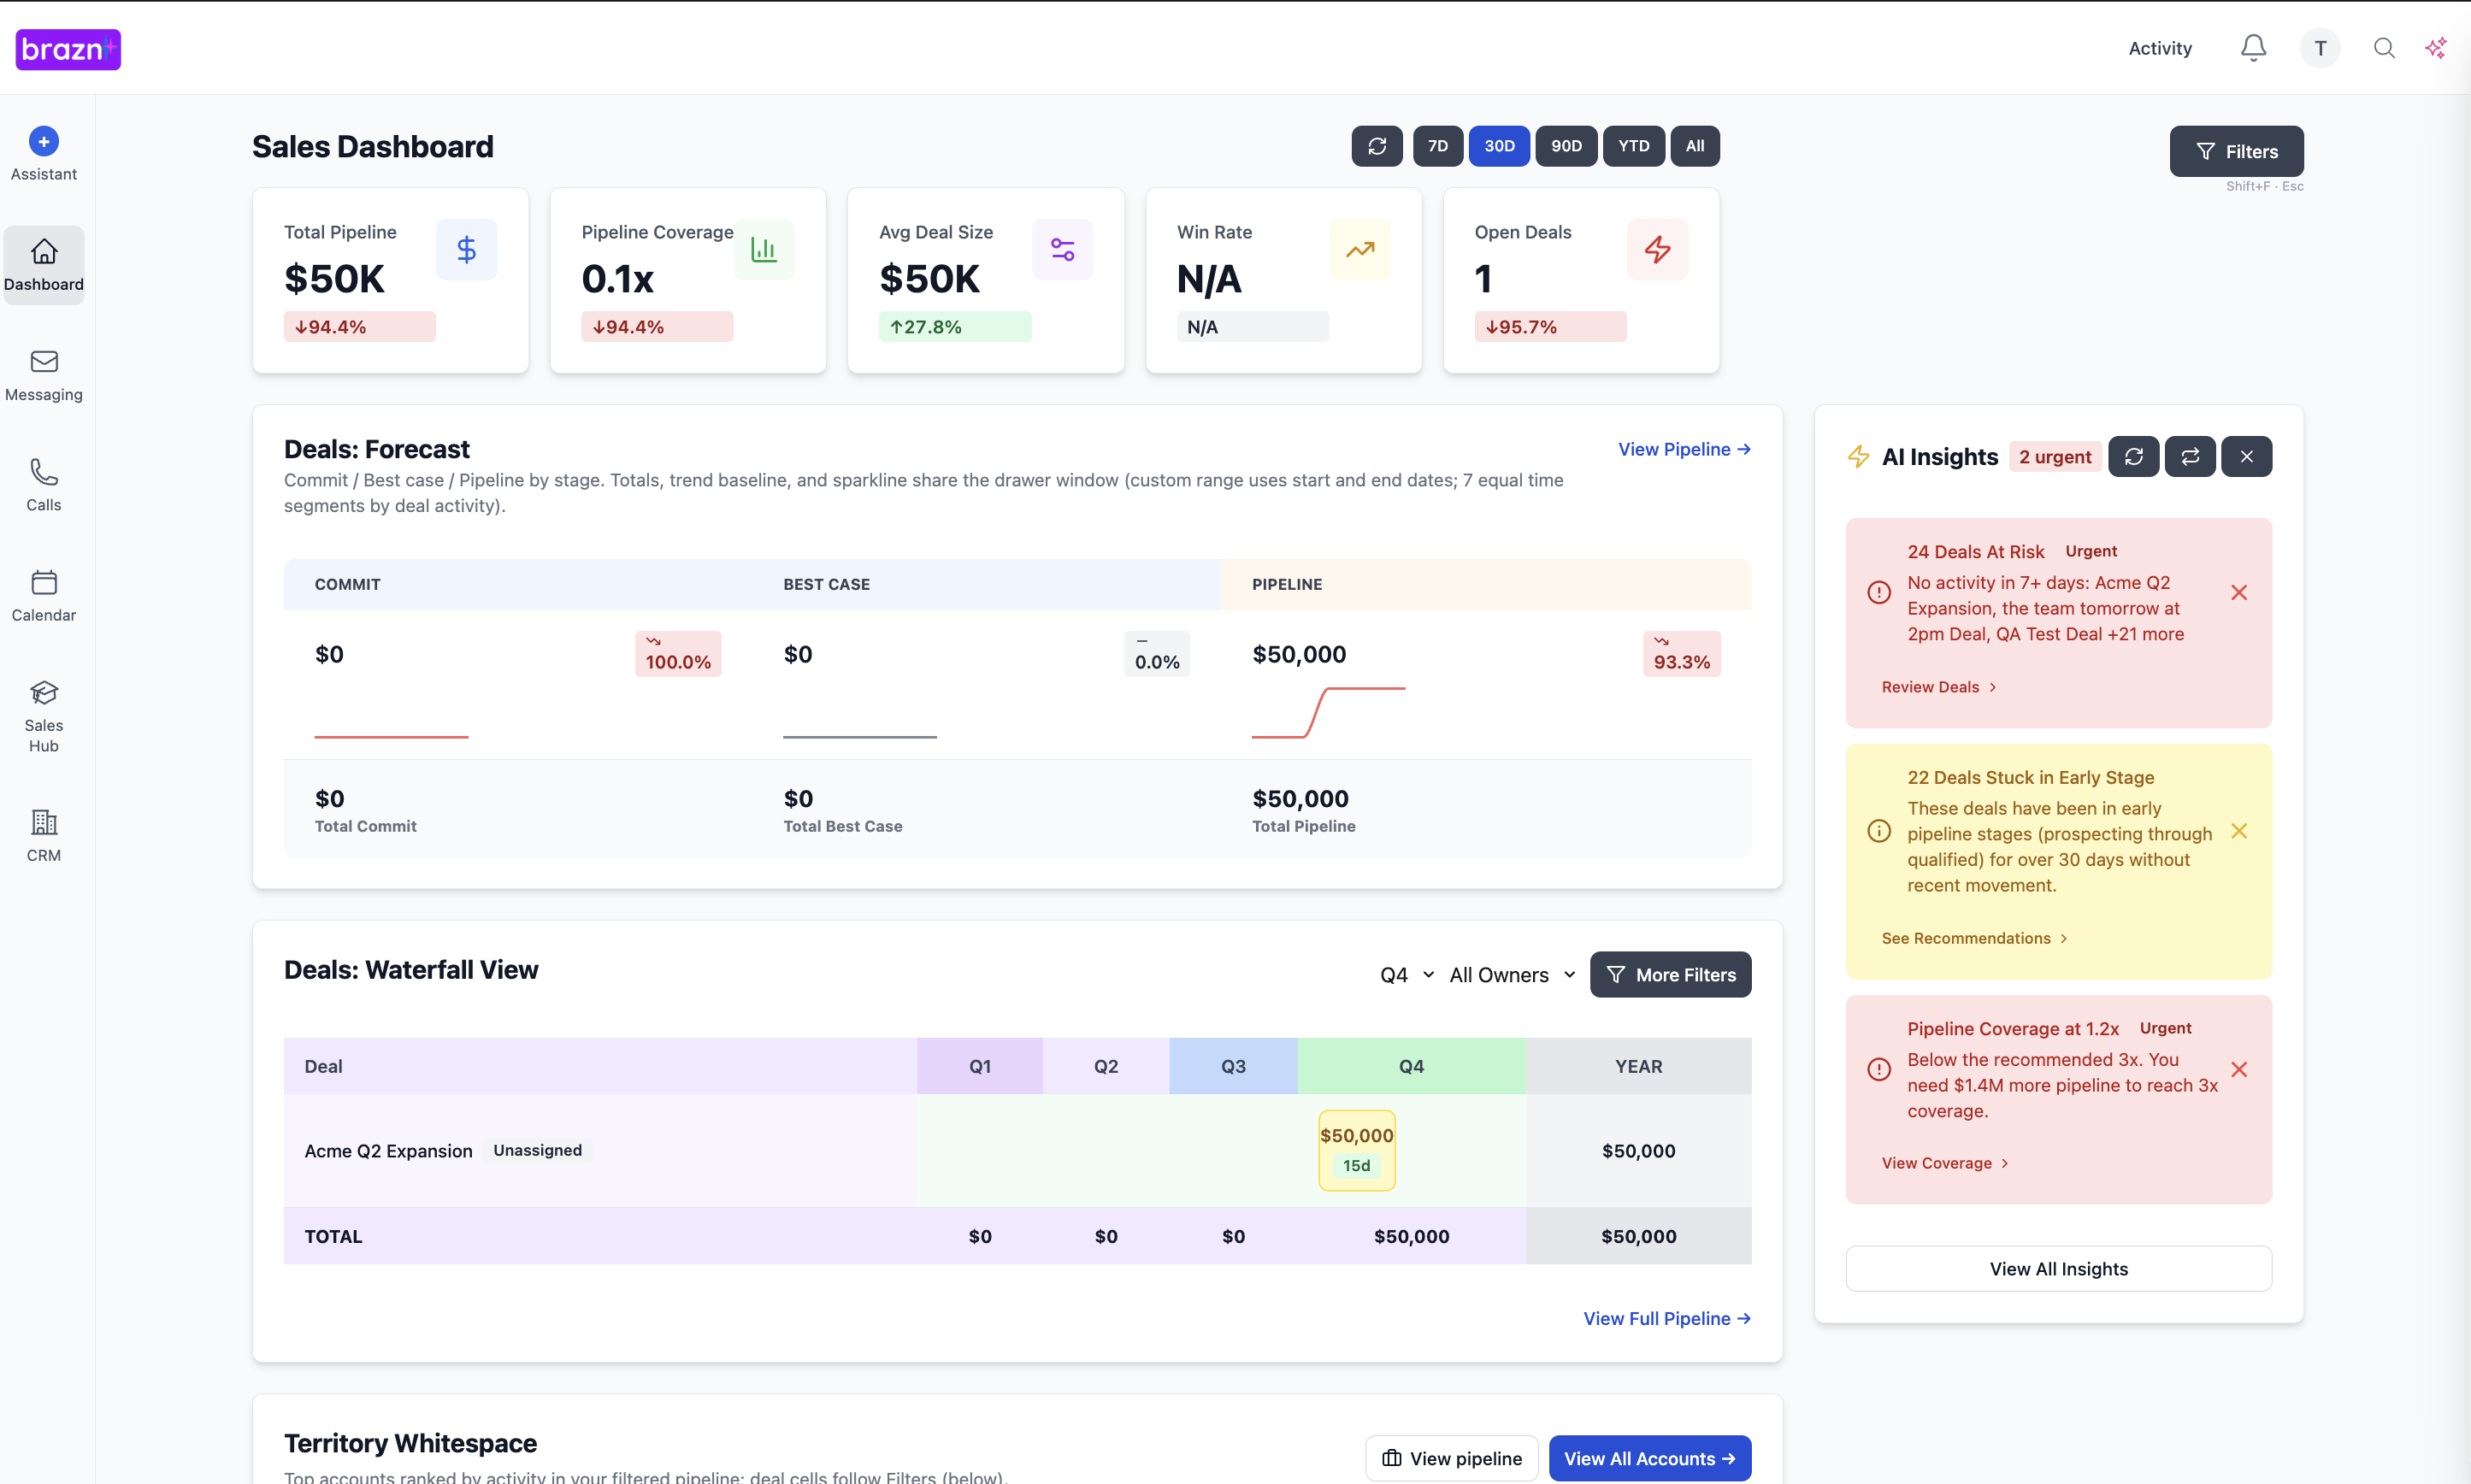
3. Pipeline Coverage Ratio: The ratio of open pipeline to the revenue target for the period (typically aiming for 3x or 4x coverage).
H3 Customer Expansion (Bottom-of-Funnel)
1. Net Revenue Retention (NRR): The percentage of recurring revenue retained from existing customers over a specific period, including expansions and downgrades.
2. Gross Revenue Retention (GRR): The percentage of recurring revenue retained, excluding expansions. This measures the true health of the core product.
3. Time to Value (TTV): The average time it takes for a new customer to achieve their first significant milestone or ROI after signing.
How to Implement This
RevOps must build the centralized dashboard that tracks these 9 KPIs, ensuring the data is pulled accurately from the CRM, Marketing Automation, and Billing systems. The CRO, CMO, and CCO should review this dashboard jointly on a weekly basis, using the data to identify bottlenecks and adjust the GTM strategy collaboratively.
Next Steps
Stop managing your revenue engine by looking at vanity metrics. By focusing on these 9 strategic KPIs, you can gain a clear, accurate picture of your GTM health and make the data-driven decisions necessary for efficient growth.
Audit your primary leadership dashboard this week. If it contains more than 15 metrics, it's too complex. Strip it down to these essential 9. Need help building a unified reporting structure? See how Brazn's analytics provide real-time visibility into your most critical KPIs.
Book a demo to see how Brazn AI fits into your sales stack.

About the Author

Alex Margarit, Sales AI Expert, SaaS Sales Leader, BMC, ServiceNow, Docusign — 25+ years in SaaS sales.