

The KPI Stack Modern CROs Actually Run Their Business On
The typical Chief Revenue Officer (CRO) dashboard is a mess. It's overflowing with vanity metrics, lagging indicators, and data points that look impressive but offer no actionable insight. The problem? when you track everything, you focus on nothing. CROs end up managing the dashboard rather than managing the business, reacting to missed targets after the fact instead of steering the ship in real-time.
In this article, we will cut through the noise and reveal the "KPI Stack" that modern, high-performing CROs actually use. By focusing on a tight set of leading and lagging indicators, you can gain true visibility into the health of your revenue engine.
What We'll Cover
In this article, we will cover:
- The danger of dashboard sprawl and vanity metrics
- The difference between leading and lagging indicators
- The 5 essential KPIs every CRO must track
- How to structure your operating rhythm around these metrics
Understanding the Approach
The "KPI Stack" is a curated hierarchy of metrics that provide a complete picture of revenue health. It moves from top-of-funnel leading indicators (which predict future performance) down to bottom-of-funnel lagging indicators (which measure past results).
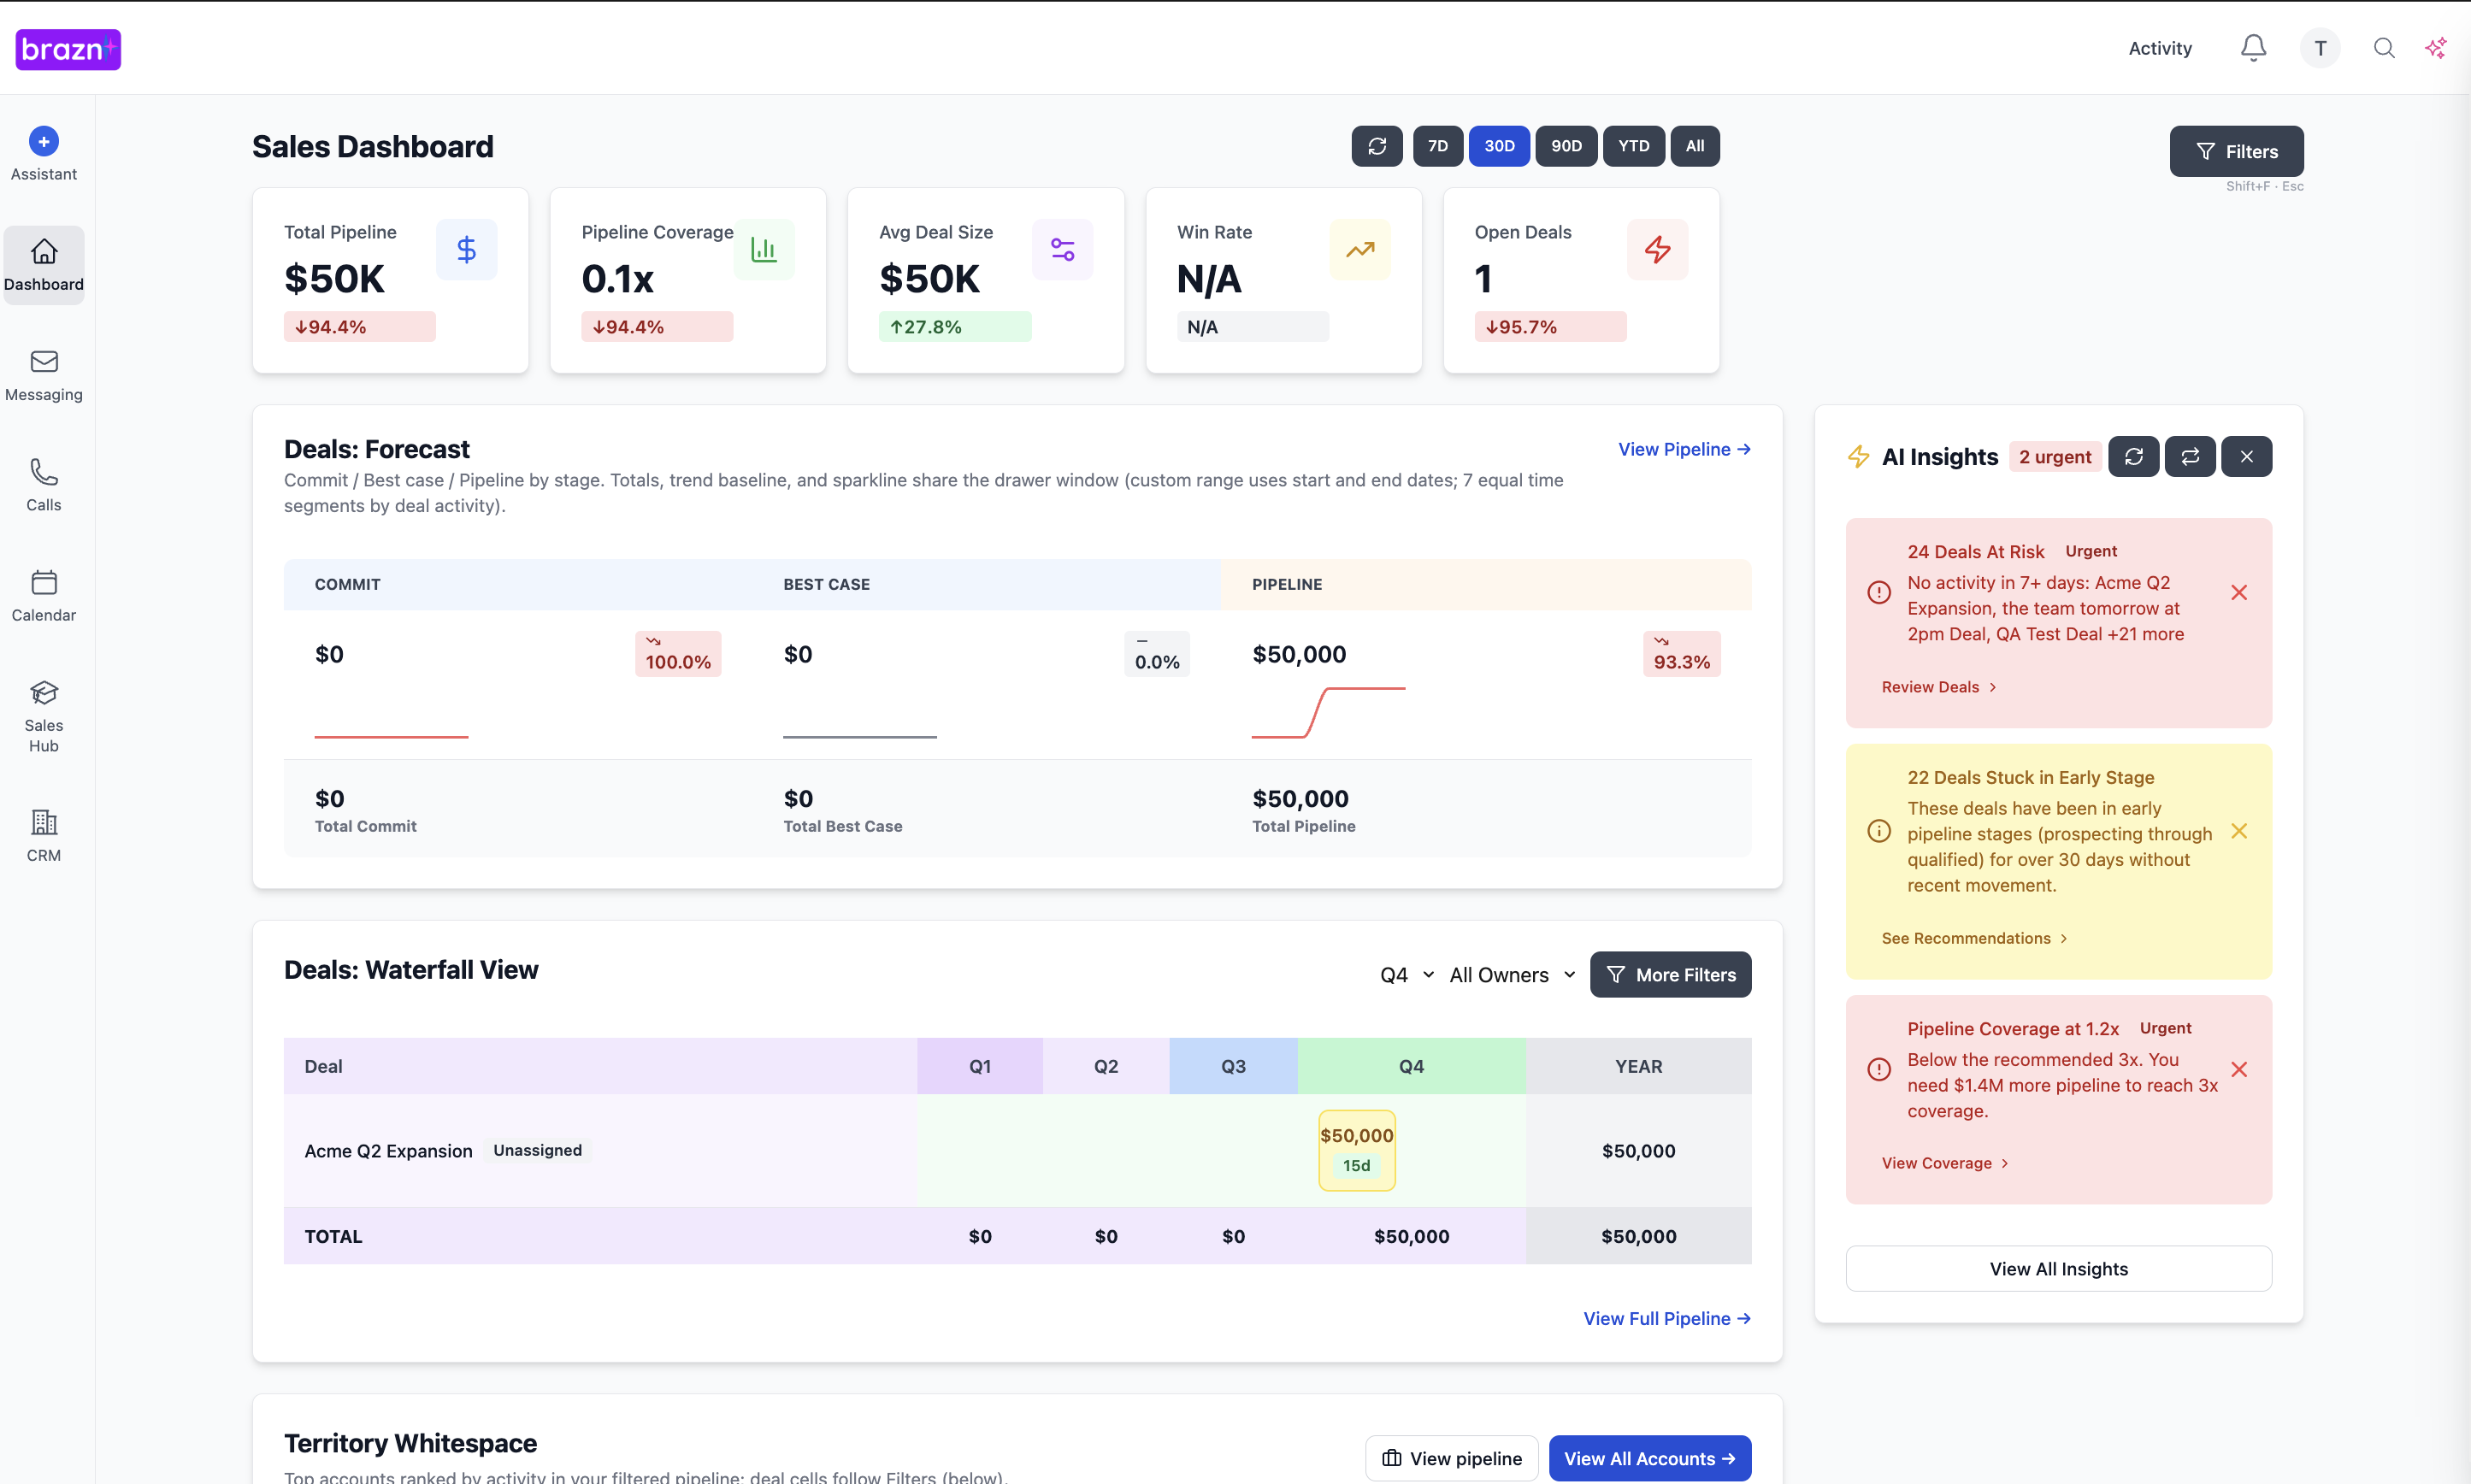
Example: Instead of obsessing over "Total Leads Generated" (a vanity metric), a modern CRO focuses on "Pipeline Coverage Ratio" (a leading indicator). If the coverage ratio drops below 3x, the CRO knows they need to immediately launch Sales Pipeline generation plays to avoid missing the revenue target next quarter.
Why This Matters
A disciplined approach to KPIs is the difference between hoping to hit a target and engineering a predictable outcome.
- Before: The CRO is overwhelmed by data and can't identify the root cause of a missed quarter. After: The CRO can pinpoint exactly where the revenue engine is breaking down.
- Before: Sales managers focus on activity metrics (e.g., number of calls) rather than outcomes. After: Managers coach to specific conversion metrics that drive revenue.
- Before: Board meetings are spent debating the accuracy of the data. After: Board meetings focus on strategic decisions based on a trusted set of core metrics.
The Complete Guide
1. Pipeline Coverage Ratio (Leading)
Objective: Ensure you have enough qualified pipeline to hit your revenue target.
Actionable Advice: Calculate the ratio of your qualified pipeline to your revenue target for a given period. A healthy SaaS business typically needs a 3x to 4x coverage ratio.
Best Practices: Only include deals in the "Qualified" stage or later; exclude early-stage, speculative pipeline.
2. Win Rate by Stage (Leading/Lagging)
Objective: Identify bottlenecks in the sales process.
Actionable Advice: Track the percentage of deals that progress from one stage to the next, not just the overall win rate. This helps pinpoint exactly where deals are stalling (e.g., a low conversion rate from Demo to Proposal).
Best Practices: Analyze win rates by individual rep to identify specific coaching opportunities.
3. Sales Cycle Length (Lagging)
Objective: Measure the efficiency of your sales motion.
Actionable Advice: Track the average number of days it takes to move a deal from creation to closed-won. A lengthening sales cycle is often an early warning sign of increased Competition or a confusing buying process.
Best Practices: Segment this metric by deal size or customer segment, as enterprise deals naturally take longer than SMB.
4. Customer Acquisition Cost (CAC) Payback Period (Lagging)
Objective: Measure the financial efficiency of your GTM engine.
Actionable Advice: Calculate how many months of gross margin it takes to recover the cost of acquiring a new customer. In SaaS, a payback period of 12-18 months is generally considered healthy.
Best Practices: Review this metric quarterly with the CFO to ensure your GTM spend is sustainable.
5. Net Revenue Retention (NRR) (Lagging)
Objective: Measure the health and expansion of your existing customer base.
Actionable Advice: Track the percentage of recurring revenue retained from existing customers over a given period, including expansions and downgrades. NRR over 100% indicates that your customer base is growing even without acquiring new logos.
Best Practices: Hold Customer Success accountable for this metric, not just Sales.
How to Implement This
RevOps is the custodian of the KPI Stack. They must ensure the underlying data is accurate and that the dashboards are easy to interpret. The CRO must use these KPIs to run their weekly forecast calls and monthly business reviews, holding their VPs accountable to the specific metrics they control.Next Steps
You can't manage what you don't measure, but measuring the wrong things is equally dangerous. By adopting this streamlined KPI Stack, you can focus your attention on the levers that actually drive revenue.
Review your current dashboard today and remove three metrics that you haven't looked at in the past month. Ready to build a cleaner, more actionable reporting infrastructure? See how Brazn can help.
Book a demo to see how Brazn AI fits into your sales stack.

About the Author

Alex Margarit, Sales AI Expert, SaaS Sales Leader, BMC, ServiceNow, Docusign — 25+ years in SaaS sales.