

The Leading Indicators Modern CROs Watch Daily
Most CROs start their day by looking at a dashboard that tells them how much revenue they closed yesterday. While this is important, it's a lagging indicator—it tells you what happened, not what is going to happen. The problem? by the time a lagging indicator turns red, it's usually too late to fix the quarter.
In this article, we will highlight the specific leading indicators that modern CROs watch daily. By obsessing over these early warning signals, you can proactively steer the business and ensure predictable revenue growth.
What We'll Cover
In this article, we will cover:
- The critical difference between leading and lagging indicators
- Why focusing only on closed-won revenue is dangerous
- The 4 leading indicators you should check every morning
- How to build a "Daily Operating Rhythm" around these metrics
Understanding the Approach
A "Leading Indicator" is a metric that predicts future performance. It measures the activities and inputs that eventually lead to closed-won revenue.
Example: "Total Revenue" is a lagging indicator. "Number of First Meetings Booked" is a leading indicator. If the number of first meetings drops significantly this week, the CRO knows with certainty that pipeline will be light next month, and revenue will suffer the month after that.
Why This Matters
Shifting your focus to leading indicators allows you to manage the business proactively rather than reactively.
- Before: The CRO scrambles at the end of the quarter to close the gap. After: The CRO identifies a pipeline shortage weeks in advance and launches targeted campaigns to fix it.
- Before: 1:1s focus on why deals were lost. After: 1:1s focus on how to progress early-stage deals and build more pipeline.
- Before: Revenue is unpredictable and stressful. After: Revenue is a predictable outcome of a well-managed process.
The Complete Guide
H3 1. New Pipeline Generated (Pacing)
Objective: Ensure the top of the funnel is consistently full.
Actionable Advice: Don't just look at the total pipeline; look at the pace of pipeline generation. Compare the amount of new pipeline created this week against the historical average required to hit your targets.
Best Practices: Segment this metric by source (Inbound vs. Outbound) to identify which channels are underperforming.
H3 2. Meeting Hold Rate
Objective: Measure the quality of your Prospecting and the effectiveness of your SDRs.
Actionable Advice: Track the percentage of booked meetings that actually occur. A high number of booked meetings means nothing if the hold rate is 30%. A dropping hold rate indicates poor qualification or weak pre-meeting follow-up.
Best Practices: Implement automated pre-meeting reminder sequences to improve the hold rate.
H3 3. Stage 1 to Stage 2 Conversion Rate
Objective: Assess the quality of the pipeline entering the funnel.
Actionable Advice: Monitor how many deals progress past the initial discovery phase. If reps are creating a lot of pipeline but very little of it moves to the next stage, they're likely inflating the pipeline with unqualified deals.
Best Practices: Enforce strict exit criteria for Stage 1 to ensure only qualified deals progress.
H3 4. Deal Velocity (Days in Stage)
Objective: Identify stalled deals before they slip.
Actionable Advice: Track the average number of days deals spend in each stage. If a deal sits in the "Proposal" stage longer than your historical average, it's a leading indicator that the deal is at risk.
Best Practices: Use AI tools to automatically flag deals that have stalled and require manager intervention.
How to Implement This
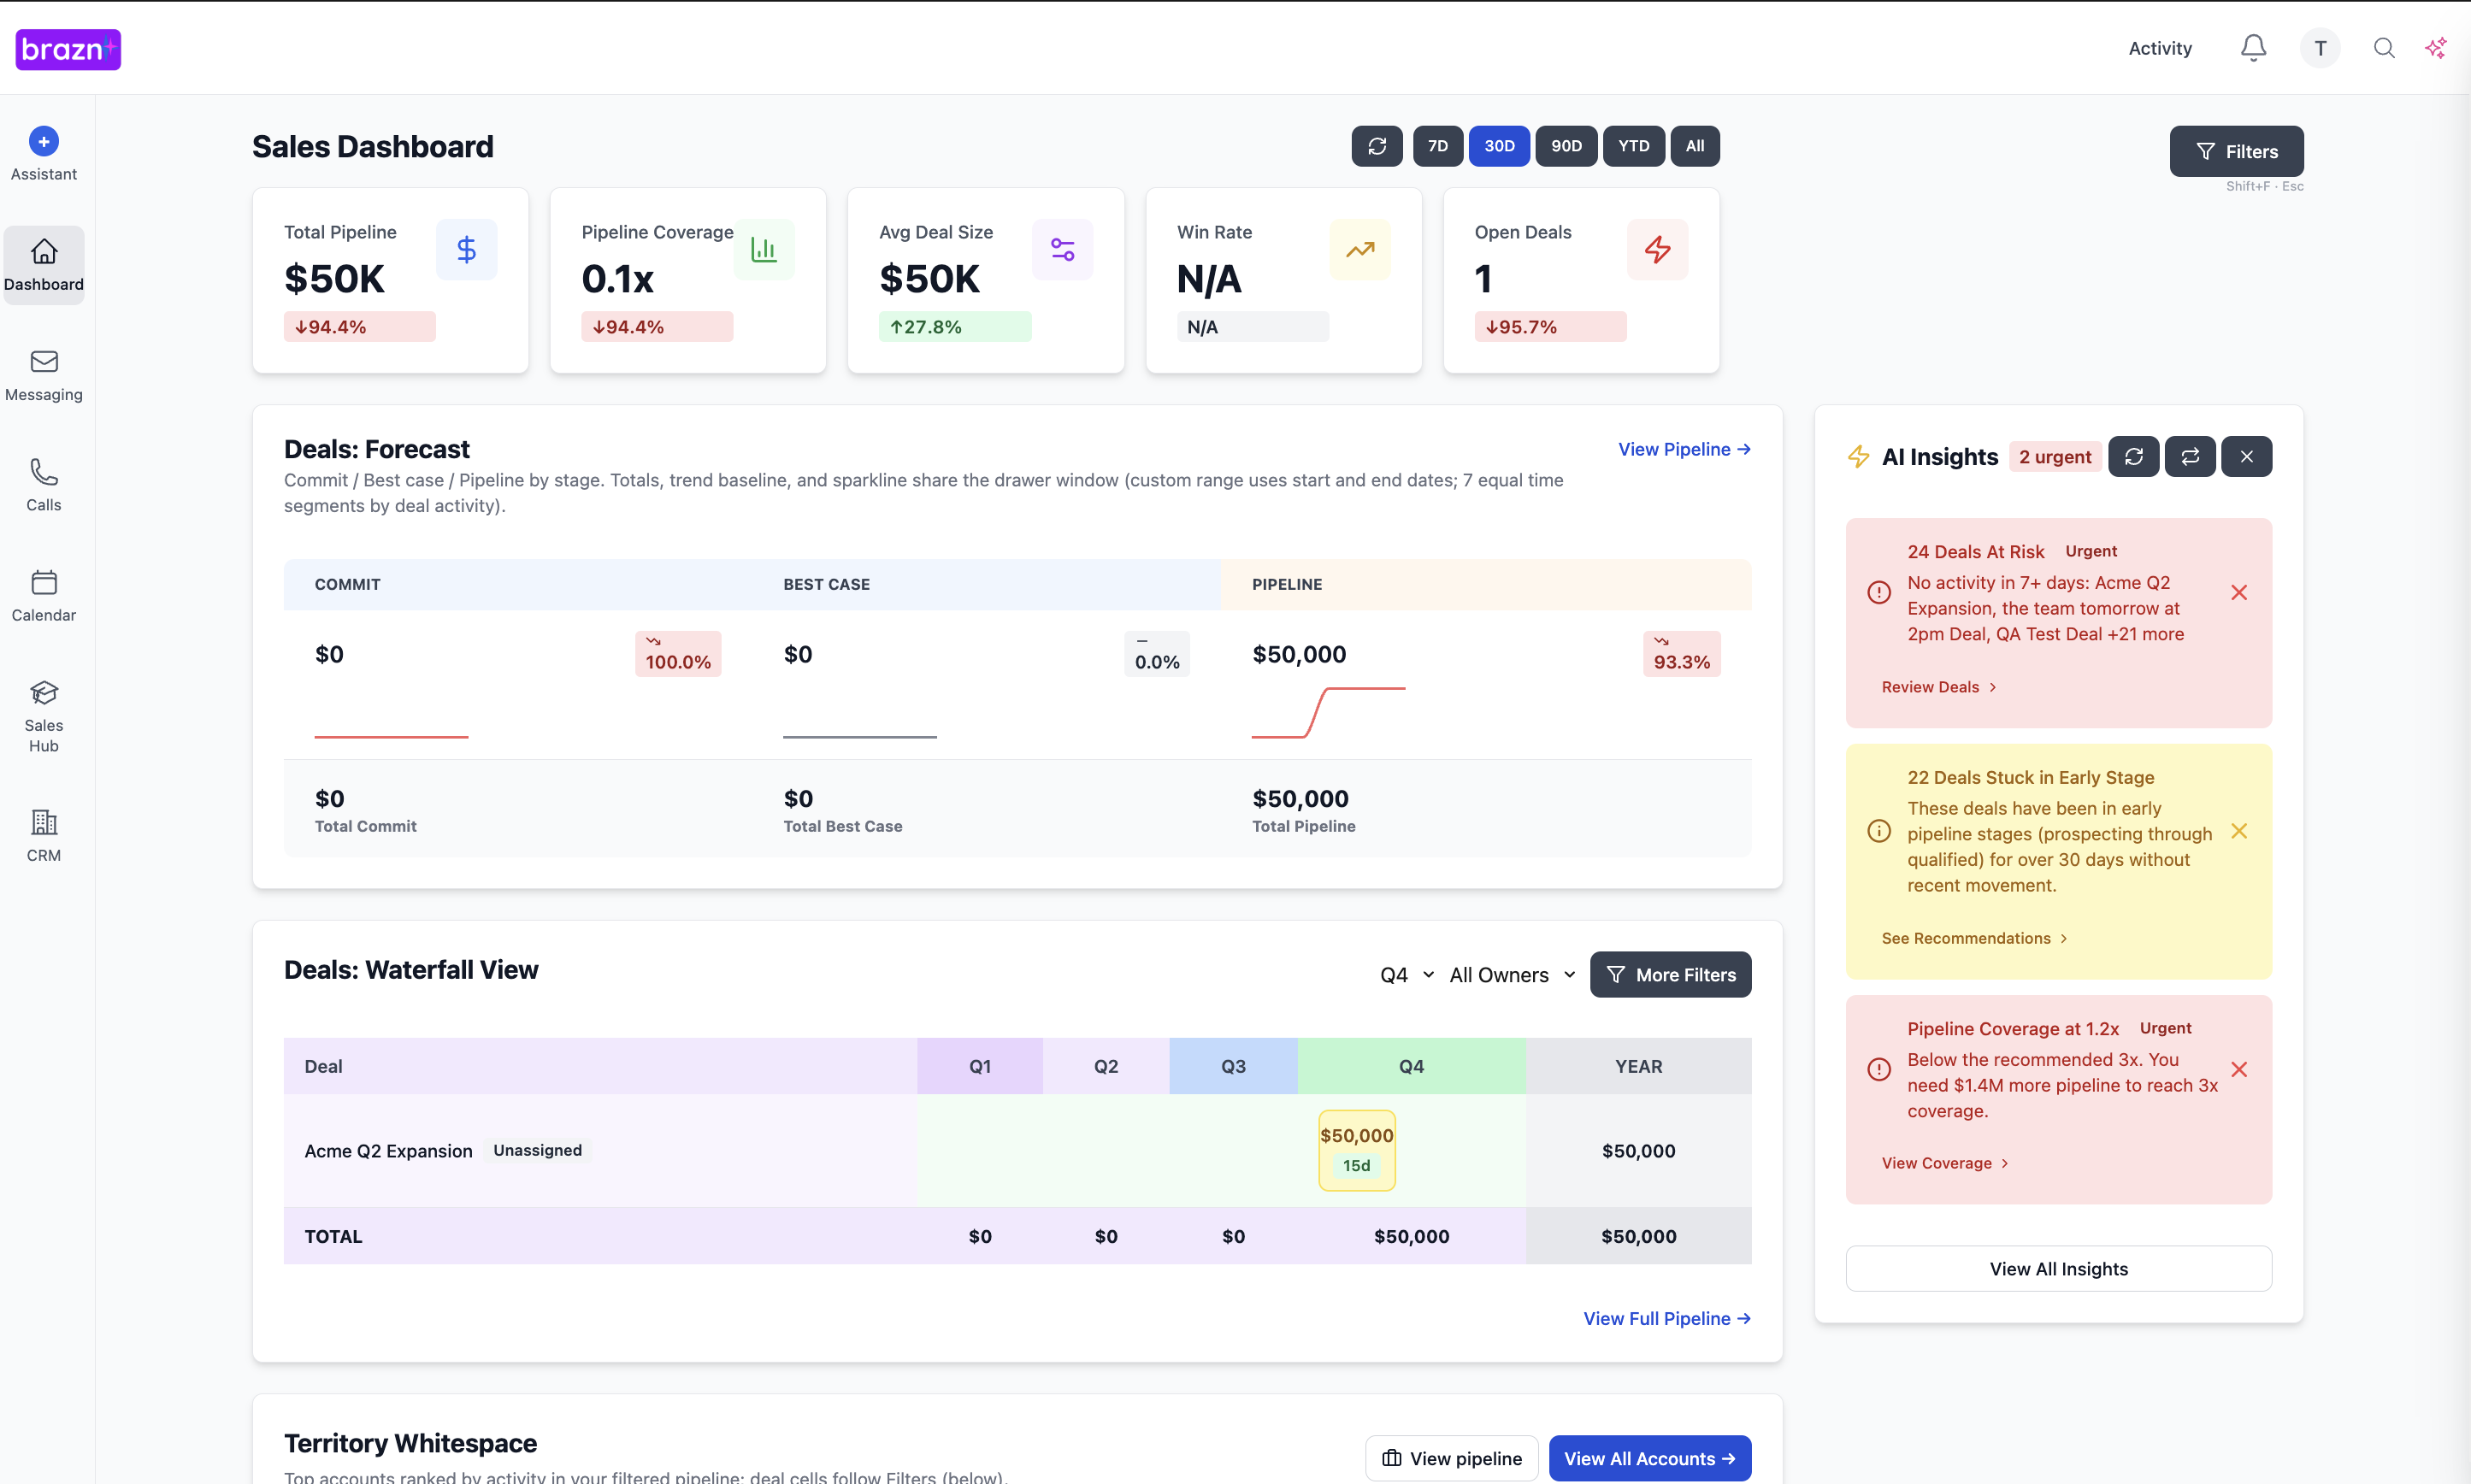
RevOps must build the daily dashboard that surfaces these leading indicators clearly. The CRO should start every morning by reviewing this dashboard. If a leading indicator flashes red, the CRO must immediately engage the relevant VP (Sales or Marketing) to diagnose the issue and implement a fix.Next Steps
Predictable revenue doesn't happen by accident; it's the result of obsessively managing the inputs. By focusing your daily attention on these leading indicators, you can take control of your forecast and drive consistent growth.
Check your dashboard right now: what is your pacing for new pipeline generation this week? Ready to get real-time visibility into your leading indicators? See how Brazn can help.
Book a demo to see how Brazn AI fits into your sales stack.

About the Author

Alex Margarit, Sales AI Expert, SaaS Sales Leader, BMC, ServiceNow, Docusign — 25+ years in SaaS sales.