


Sales Data That Actually Matters: A Field Guide for Busy CROs and RevOps Leaders
In the modern revenue organization, the problem is rarely a lack of data; it's a lack of signal. CRM dashboards are overflowing with vanity metrics—emails sent, calls made, leads generated—that create a false sense of security while obscuring the true health of the business. When CROs and RevOps leaders focus on these superficial activity metrics, they inevitably make flawed strategic decisions, leading to missed forecasts and inefficient growth.
To build a predictable revenue engine, leaders must cut through the noise and focus exclusively on the data points that directly correlate with revenue outcomes. This article serves as a field guide for identifying, tracking, and acting upon the sales data that actually matters, shifting the focus from "activity" to "impact."
What We'll Cover
In this article, we will cover:
- The danger of managing by vanity metrics
- The shift from descriptive data to predictive telemetry
- The 3 critical metrics for Pipeline Health
- The 3 critical metrics for Sales Execution
- How RevOps can build dashboards that drive action, not just awareness
Understanding the Approach
The "Data That Matters" framework categorizes metrics based on their predictive power. Instead of looking backward at what happened (e.g., "We closed $1M last month"), it focuses on leading indicators that predict what will happen (e.g., "Our deal velocity in the proposal stage has increased by 10%, indicating a likely beat on this quarter's forecast").
Example: A traditional sales manager tracks "Number of Discovery Calls" (a vanity metric). A data-driven CRO tracks the "Discovery-to-Proposal Conversion Rate" segmented by lead source. If the conversion rate for outbound leads drops significantly, the CRO knows immediately that the outbound messaging is failing, rather than just seeing that the reps are "busy."
Why This Matters
Focusing on the right data is essential for diagnosing pipeline bottlenecks, improving forecast accuracy, and allocating resources efficiently.
- Before: Leadership celebrates a record number of MQLs, only to miss the revenue target because the leads were low quality. After: Leadership tracks "Cost-Per-Opportunity," ensuring marketing spend is actually driving qualified pipeline.
- Before: Managers coach reps based on gut feeling and subjective call reviews. After: Managers coach reps based on objective conversion metrics, identifying exactly where a rep struggles in the sales cycle.
- Before: The board update is a chaotic defense of missed numbers. After: The board update is a confident presentation of leading indicators and strategic adjustments.
The Complete Guide
H3 Metrics for Pipeline Health
1. Pipeline Velocity: (Number of Qualified Opportunities Win Rate Average Deal Size) / Sales Cycle Length. This is the ultimate measure of your revenue engine's speed and efficiency.
2. Stage-to-Stage Conversion Rates: Track the drop-off between every stage in your CRM. A sudden drop between "Demo" and "Proposal" indicates a specific problem with your presentation or pricing.
3. Source-Specific CAC Payback: Don't look at blended CAC. Track how long it takes to pay back the acquisition cost of an inbound lead vs. an outbound lead vs. a partner lead to optimize your marketing spend.
H3 Metrics for Sales Execution
1. "Clean" Pipeline Coverage: Standard pipeline coverage (e.g., 3x) is meaningless if the pipeline is full of dead deals. Track coverage using only opportunities that have had a two-way interaction in the last 14 days.
2. Deal Slip Rate: The percentage of deals in the "Commit" stage that have their close date pushed to the next quarter. A high slip rate indicates "happy ears" and poor qualification.
3. Multi-Threading Score: The average number of active contacts associated with deals in the final stages. Single-threaded deals are the biggest risk to enterprise forecasts.
How to Implement This
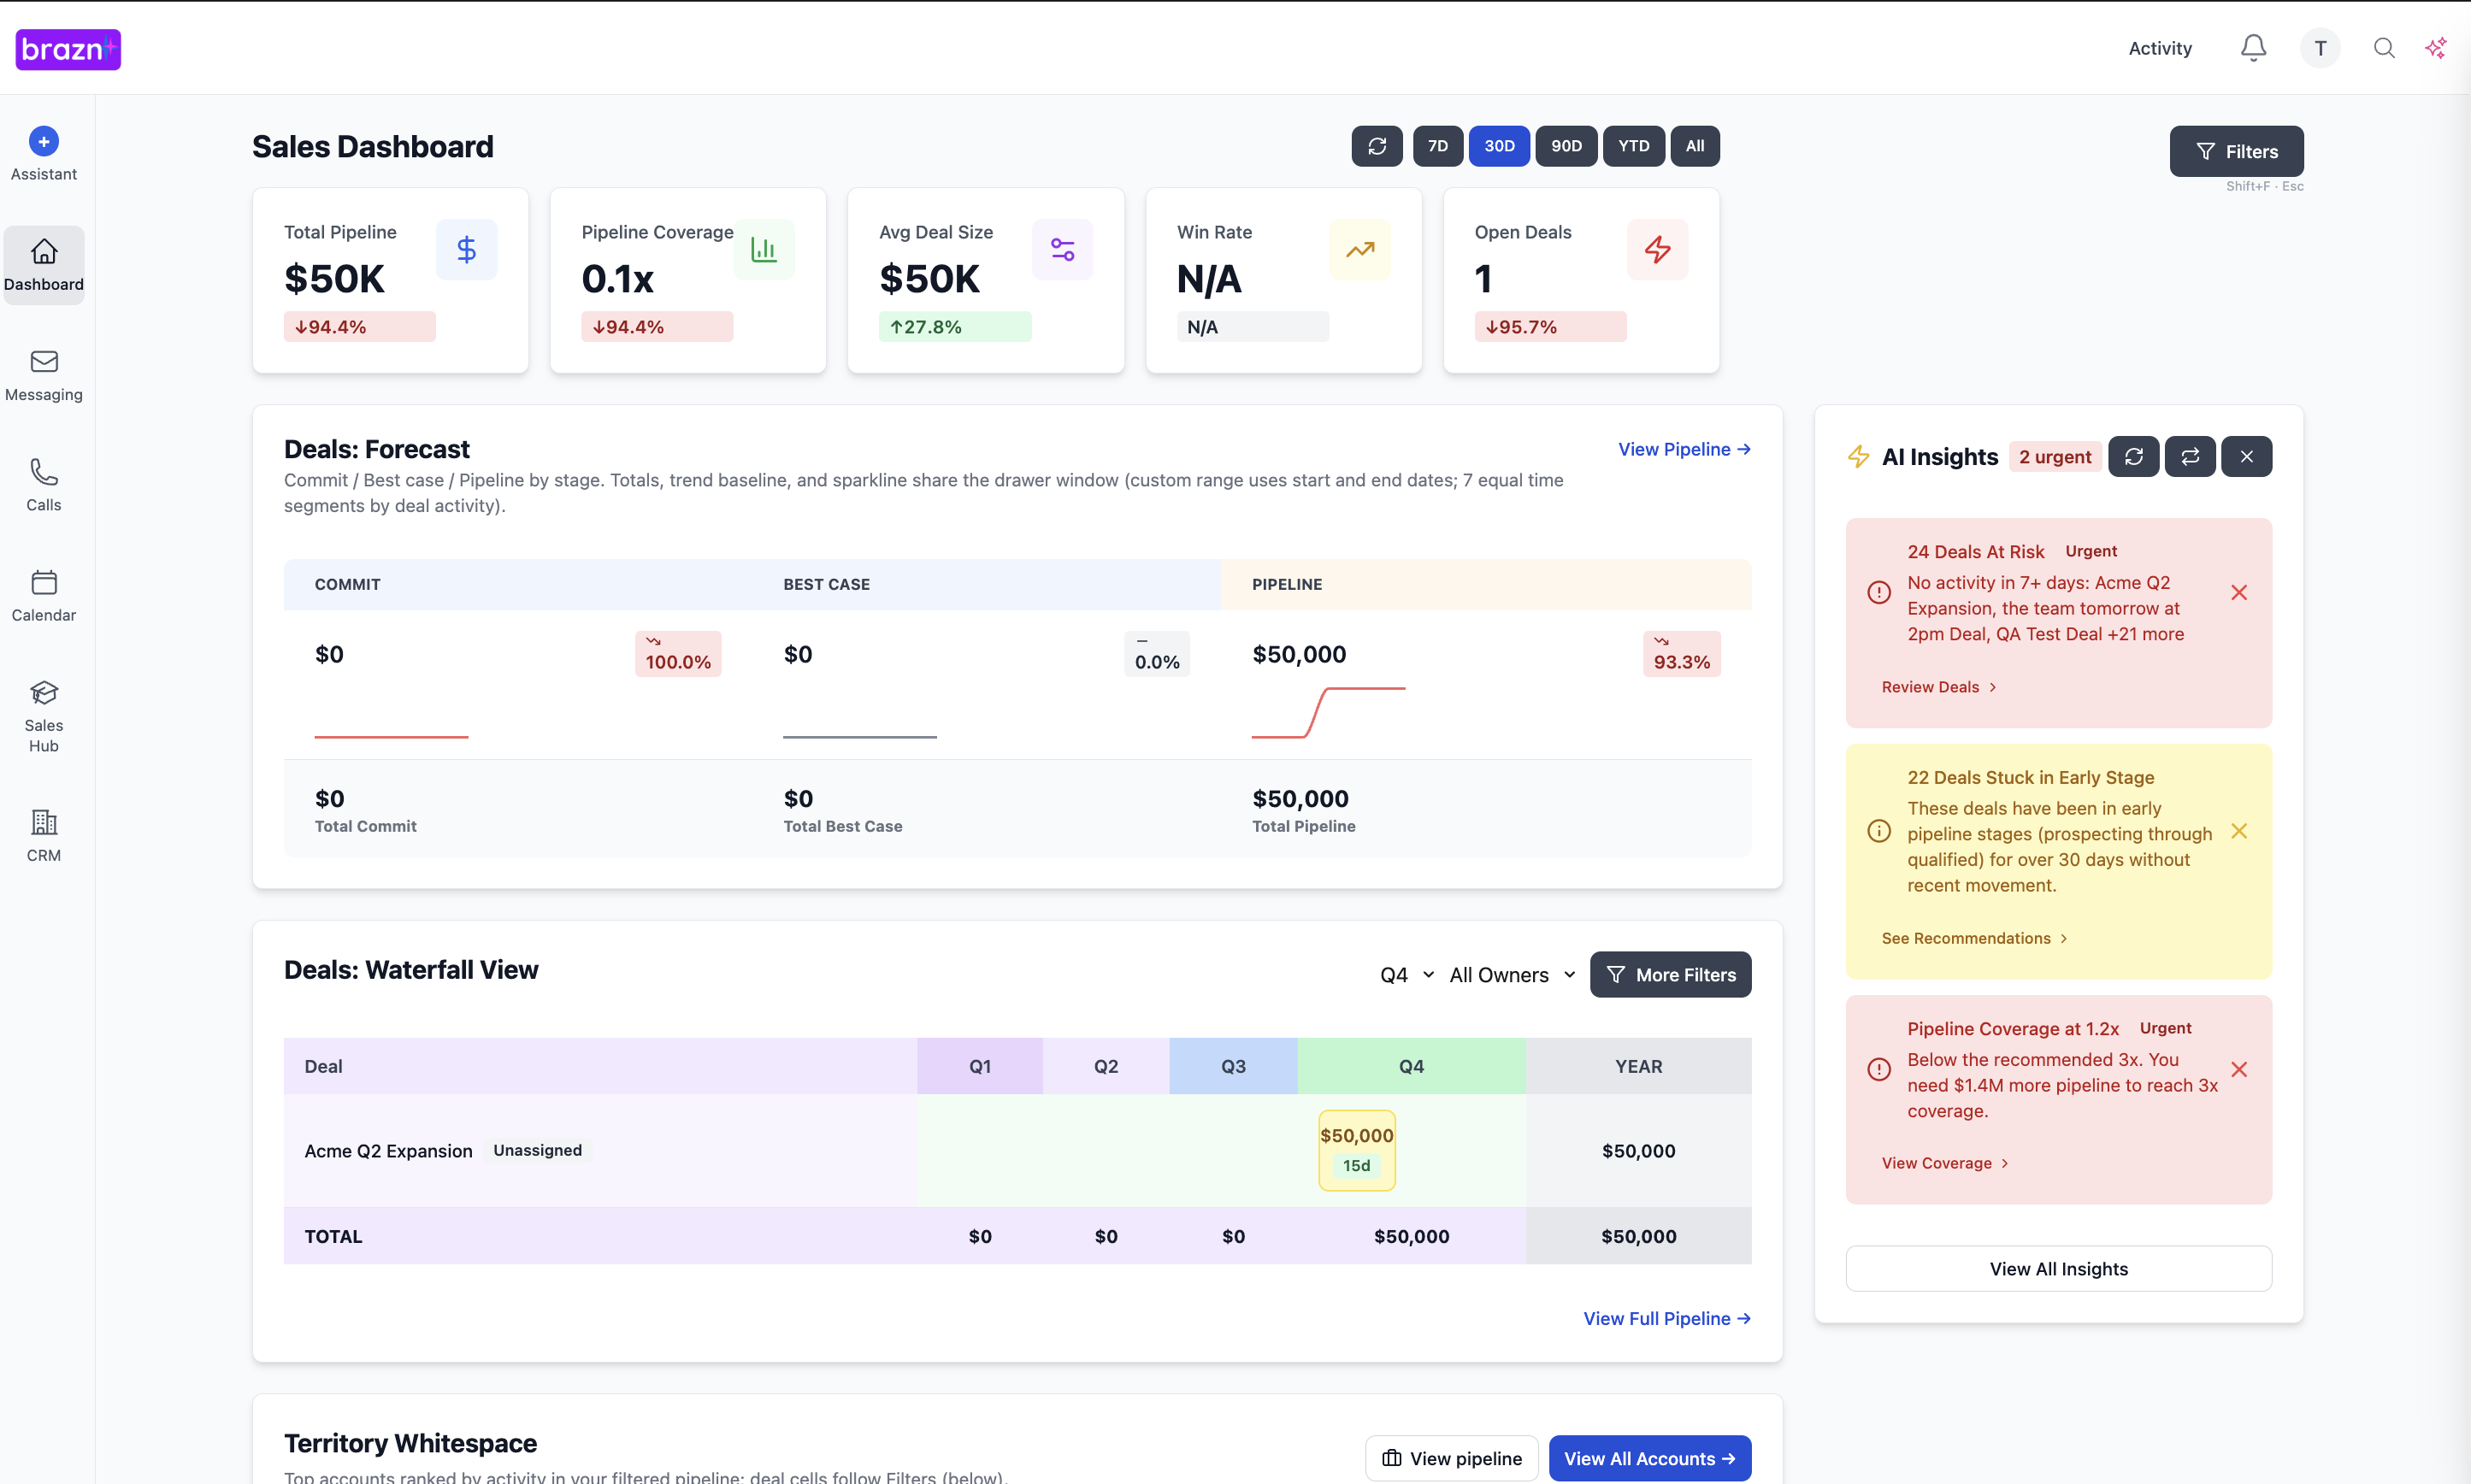
RevOps is the custodian of these metrics. They must ensure the CRM architecture supports accurate tracking (e.g., enforcing mandatory fields before a deal can change stages). More importantly, RevOps must design dashboards that are prescriptive. Instead of just showing the "Deal Slip Rate," the dashboard should list the specific deals that are currently slipping and suggest an automated re-engagement play for the rep.
Next Steps
You can't manage what you don't accurately measure. By abandoning vanity metrics and focusing ruthlessly on the data that drives outcomes, you can transform your revenue organization from a chaotic "hustle culture" into a predictable, scalable machine.
Audit your primary executive dashboard today. If it includes "Emails Sent" or "Total Leads," remove them. Replace them with "Pipeline Velocity" and "Stage-to-Stage Conversion." Ready to track the metrics that matter? See how Brazn's platform surfaces the deep telemetry of your revenue engine.
Book a demo to see how Brazn AI fits into your sales stack.

About the Author

Alex Margarit, Sales AI Expert, SaaS Sales Leader, BMC, ServiceNow, Docusign — 25+ years in SaaS sales.