


Pruning Dashboards Without Losing Insight
Walk into any RevOps department, and you will likely find a graveyard of abandoned dashboards. Over the years, every new sales manager, marketing leader, and executive has requested a custom report, leading to a sprawling, unmanageable mess of data visualization. This "dashboard sprawl" doesn't create alignment; it creates confusion. When there are 50 different ways to look at the pipeline, teams spend more time arguing about which dashboard is "right" than they do actually fixing the business.
The solution isn't to build another dashboard to rule them all. The solution is ruthless pruning. This article provides a framework for RevOps leaders to audit, consolidate, and eliminate unnecessary reporting, ensuring that the remaining dashboards deliver clear, actionable insight rather than cognitive overload.
What We'll Cover
In this article, we will cover:
- The hidden costs of dashboard sprawl in a revenue org
- The "Insight vs. Information" framework for evaluating reports
- A 3-step process for auditing and pruning your CRM dashboards
- How to handle executive pushback when deleting their "favorite" report
- Designing a core set of essential, AI-augmented dashboards
Understanding the Approach
Dashboard pruning is the systematic process of evaluating every existing report and dashboard against a strict criteria of actionability. If a dashboard provides "interesting information" but doesn't directly inform a specific business decision or workflow, it's archived.
Example: A RevOps team audits a "Leads by State" dashboard that was requested two years ago. They discover it's viewed once a month and has never triggered a change in marketing spend or sales territory alignment. Because it provides information but no actionable insight, the dashboard is deleted, reducing clutter and focusing the team on the core "Pipeline Velocity" dashboard.
Why This Matters
Eliminating dashboard sprawl is essential for creating a single source of truth, reducing RevOps maintenance time, and driving faster, data-backed decisions.
- Before: Sales and Marketing bring different numbers to the weekly revenue meeting, leading to arguments over data accuracy. After: Everyone works from a single, consolidated dashboard, focusing the meeting on strategy rather than data validation.
- Before: RevOps spends 20 hours a week updating and fixing broken reports that nobody actually uses. After: RevOps spends their time analyzing data and deploying AI workflows, knowing the core dashboards are stable.
- Before: Reps ignore the CRM because the reporting interface is overwhelming and confusing. After: Reps use a clean, focused dashboard that clearly highlights the specific actions they need to take today.
The Complete Guide
Step 1: The Usage Audit
Objective: Identify the "zombie" dashboards that are consuming resources but providing no value.
Actionable Advice: Use your CRM's administrative reporting features to run a usage audit on all dashboards. Identify any dashboard that hasn't been viewed by more than two people in the last 60 days. Move these to a hidden "Archive" folder immediately.
Best Practices: Do not ask for permission before archiving unused dashboards; if someone truly needs it, they will ask for it back (they rarely do).
Step 2: The "Actionability" Test
Objective: Evaluate the remaining dashboards to ensure they drive business decisions.
Actionable Advice: For every active dashboard, ask the owner: "What specific action do you take if this metric goes up or down?" If the answer is "I just like to know," the dashboard is a prime candidate for deletion or consolidation.
Best Practices: Consolidate multiple "informational" reports into a single, high-level executive summary, rather than maintaining separate dashboards for each metric.
Step 3: Integrating AI-Surfaced Insights
Objective: Move from descriptive reporting (what happened) to prescriptive reporting (what to do next).
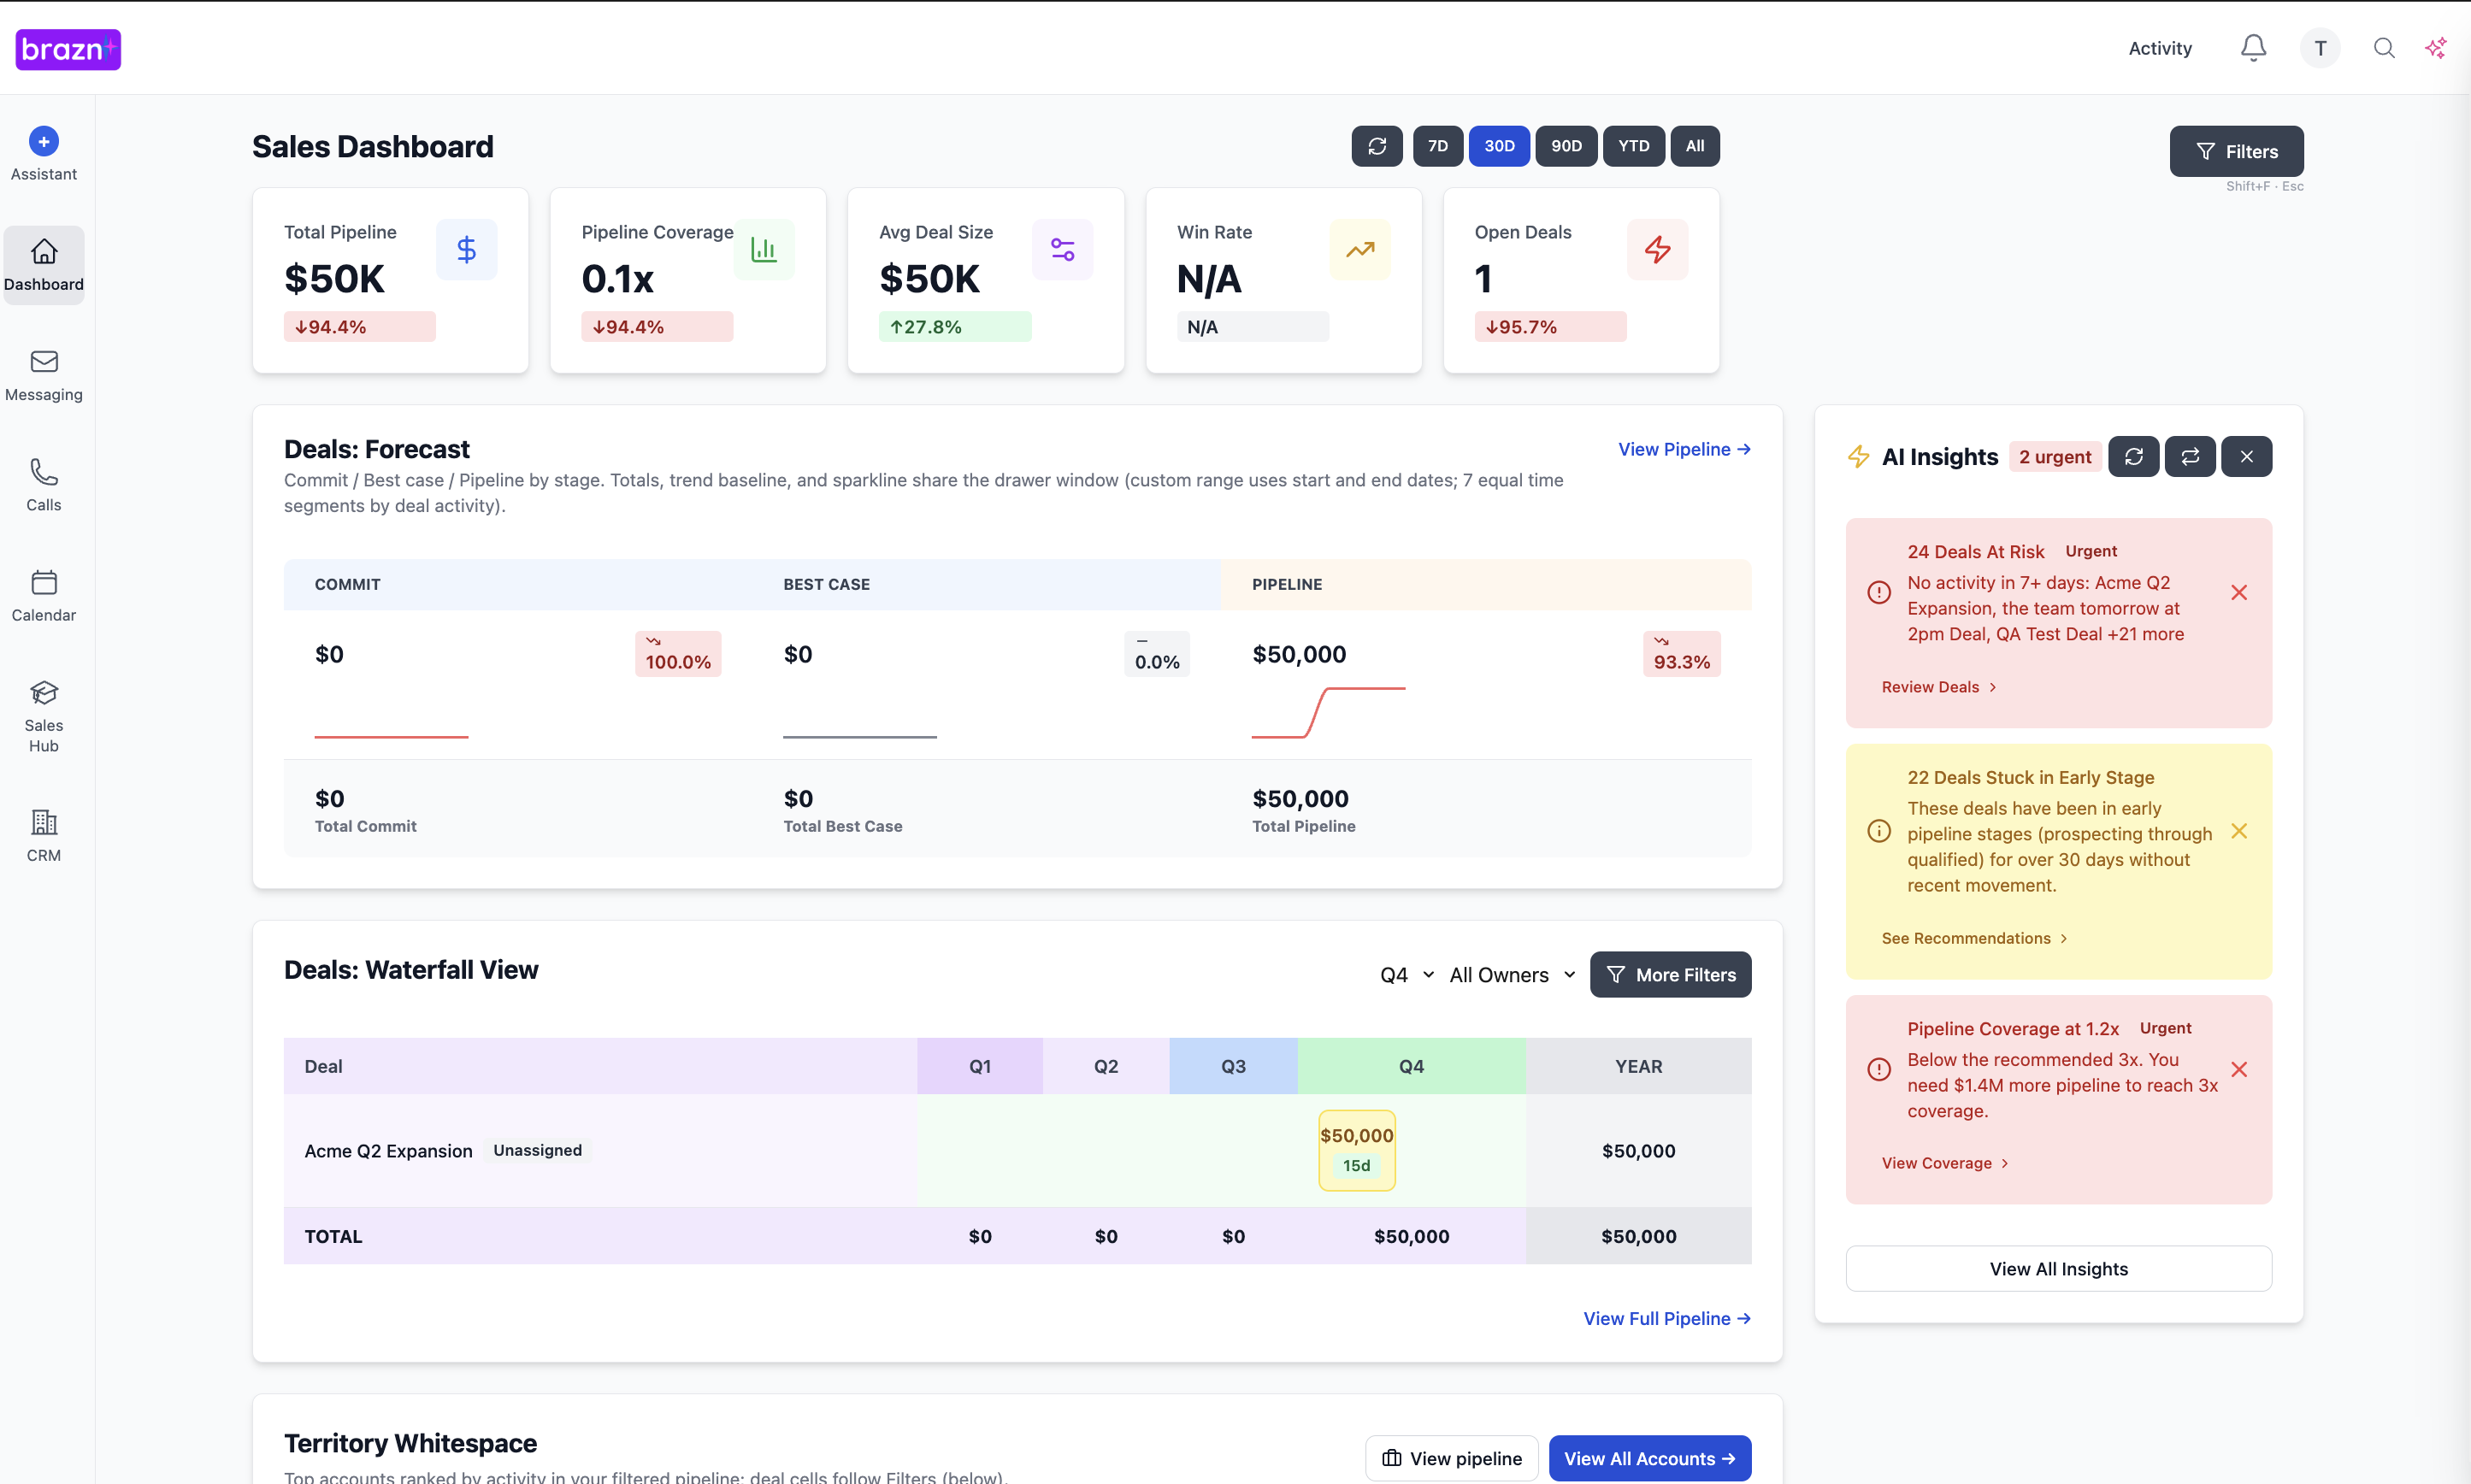
Actionable Advice: When redesigning your core dashboards, replace static charts with AI-generated insights. Instead of a chart showing "Deals in Proposal Stage," use an AI widget that highlights "Deals in Proposal Stage with High Risk of Slipping," complete with suggested next actions.
Best Practices: Ensure AI insights are clearly labeled and explain the "why" behind the recommendation to build trust with the users.
How to Implement This
RevOps must lead the pruning initiative, acting as the gatekeeper for all new reporting requests. When a leader requests a new dashboard, RevOps must enforce a strict intake process, requiring the leader to define the specific business question the dashboard will answer and the actions it will drive. Sales and Marketing leadership must support RevOps in this effort, accepting that "less is more" when it comes to data visualization.
Next Steps
More data doesn't equal better decisions. By ruthlessly pruning your dashboards and focusing only on actionable insights, you can cut through the noise and align your entire revenue team around the metrics that actually matter.
Run a usage report on your CRM dashboards today. Identify the bottom 20% of dashboards by view count and archive them immediately. Ready to build prescriptive, AI-augmented dashboards? See how Brazn surfaces the insights you need without the clutter.
Book a demo to see how Brazn AI fits into your sales stack.

About the Author

Alex Margarit, Sales AI Expert, SaaS Sales Leader, BMC, ServiceNow, Docusign — 25+ years in SaaS sales.