


Content: # Drowning in GTM Dashboards? 4 Filters to Get to the Only Metrics Your Reps Need Daily
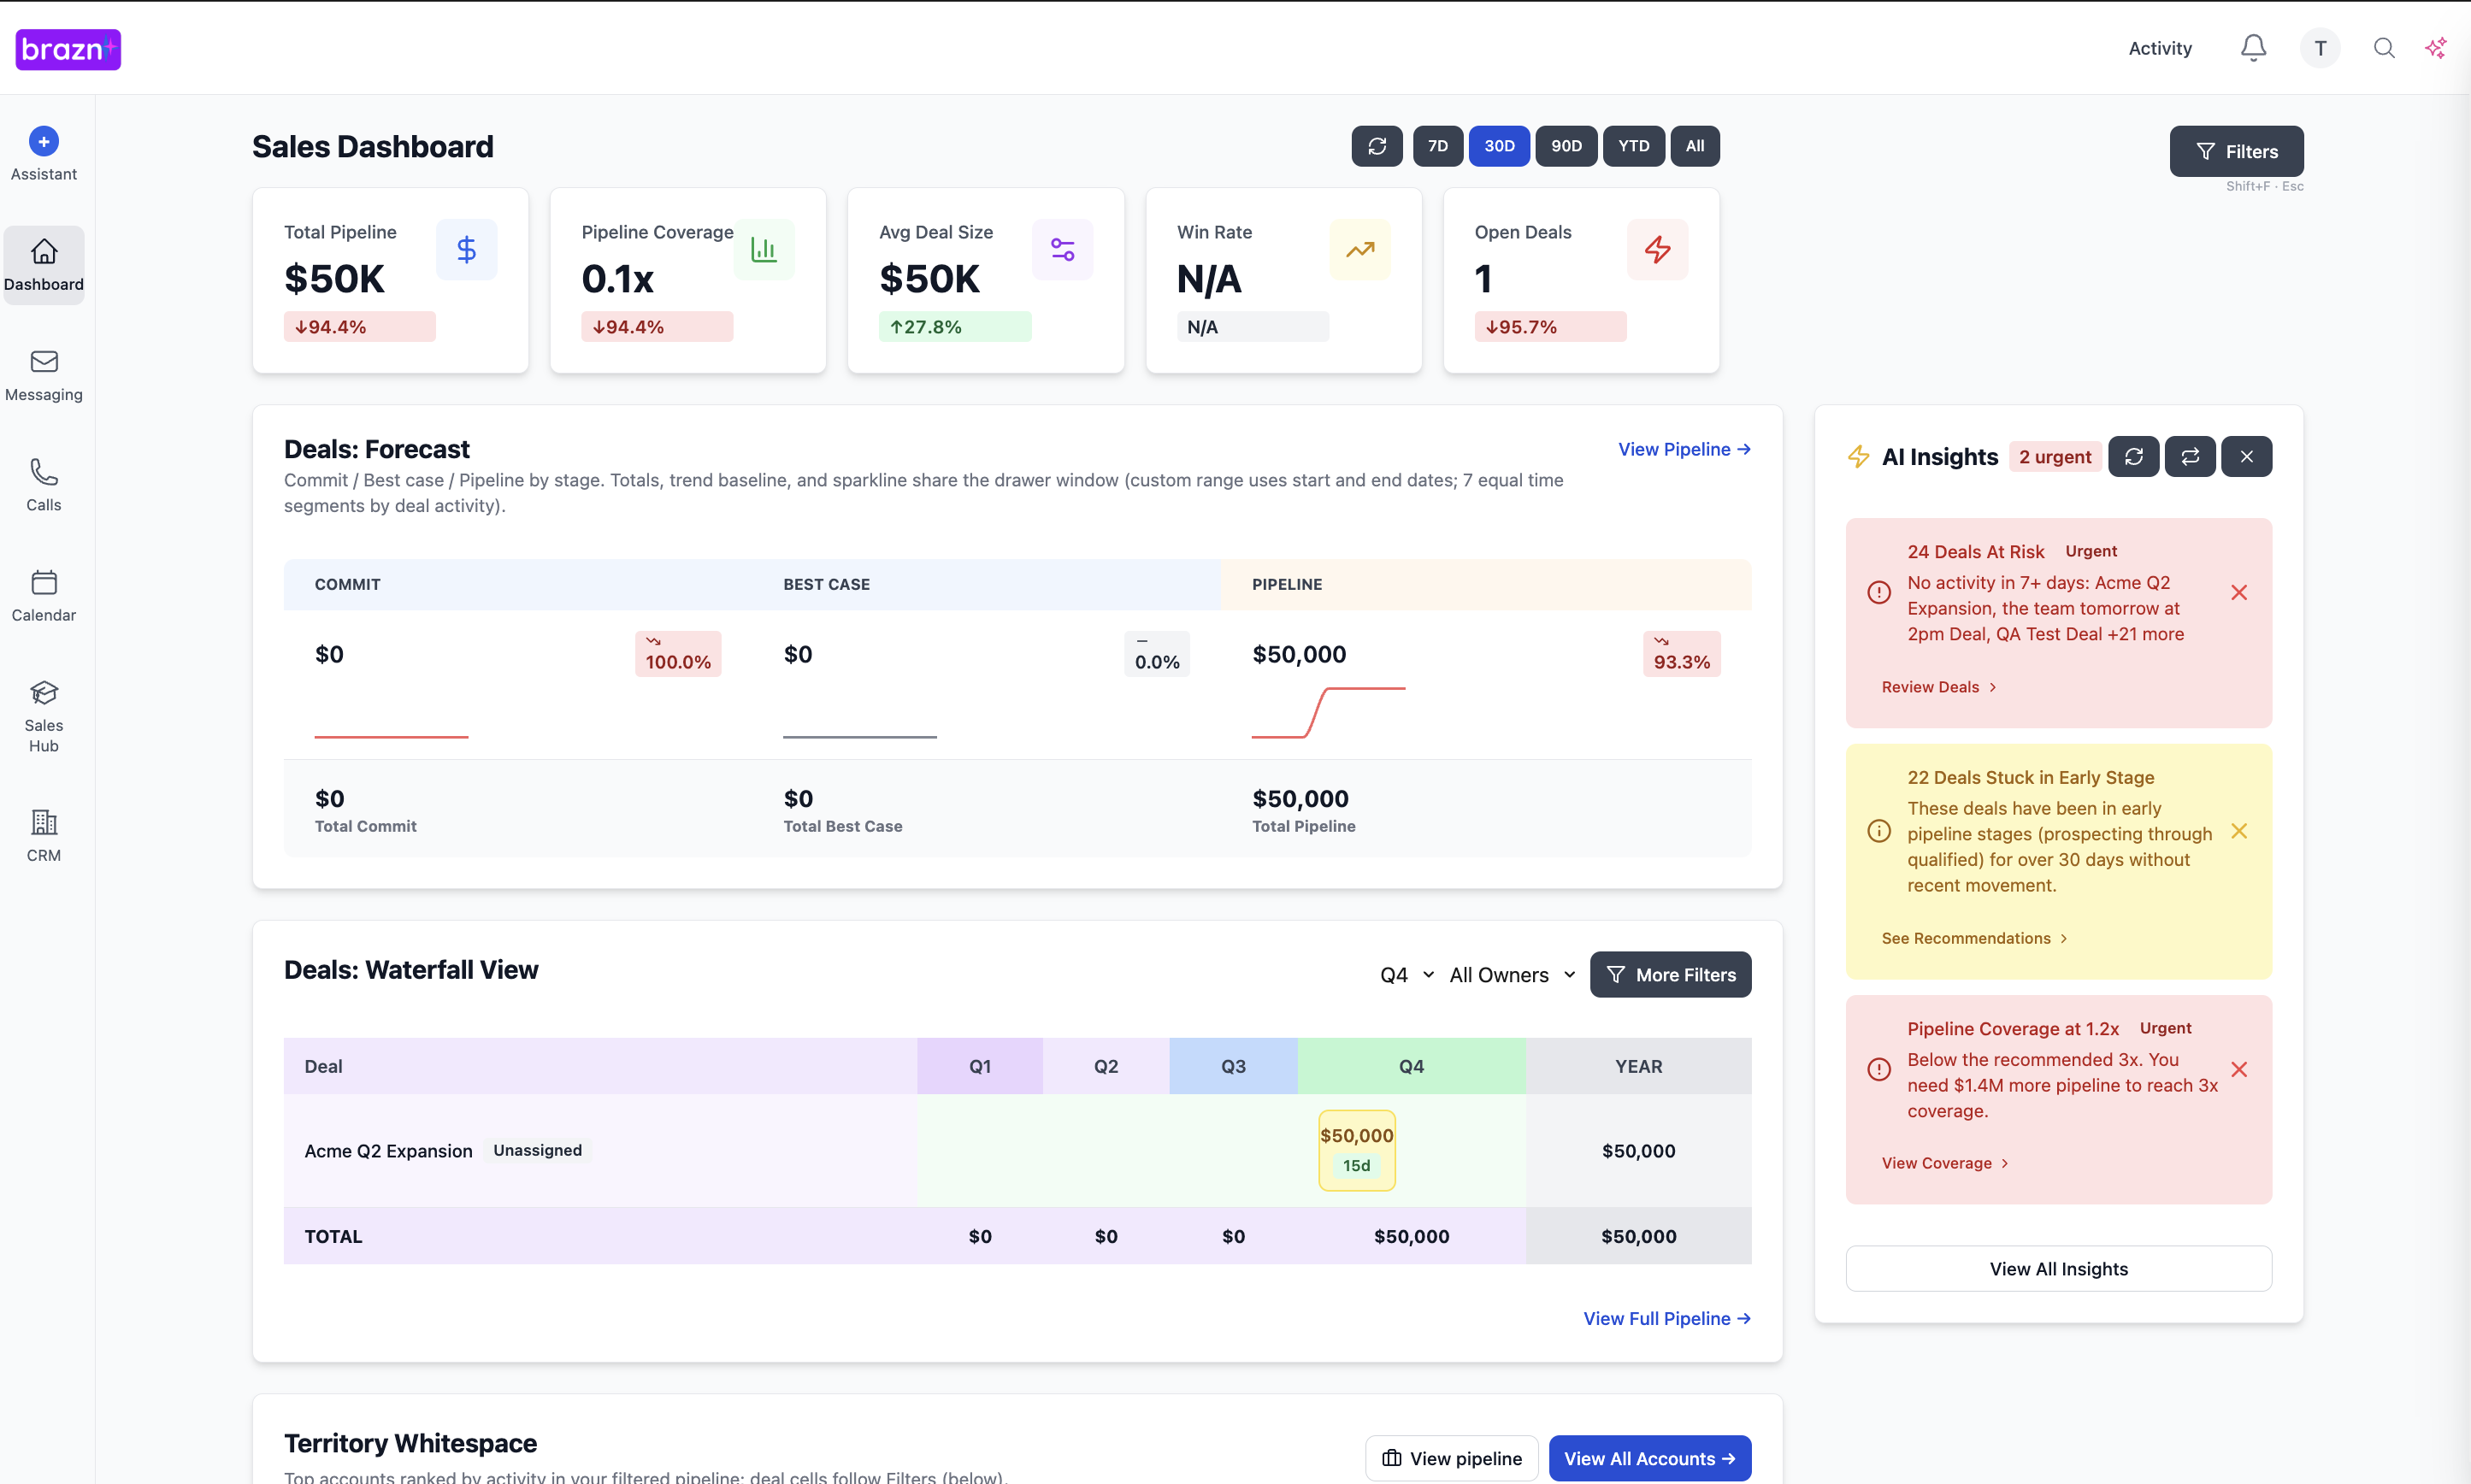
If you log into the CRM of almost any B2B SaaS company, you'll likely find a sales dashboard that looks like the cockpit of a commercial airliner. There are gauges for call volume, charts for email open rates, leaderboards, pipeline coverage ratios, and a dozen other metrics blinking for attention. The problem? Most sales reps are overwhelmed by this visual noise. When everything is highlighted as important, nothing is.
This dashboard bloat is often the result of RevOps trying to serve too many masters—leadership, marketing, and finance—all on the same screen. The unintended consequence is that the very people who need to take action (the sales reps) ignore the dashboards entirely because they can't quickly discern what they actually need to do today to hit their number.
This article provides a framework for cutting through the clutter. We will introduce 4 essential filters that RevOps can use to strip away the noise and create a hyper-focused, daily dashboard that actually drives rep behavior and revenue outcomes.
What We'll Cover
In this article, we will cover:
- Why complex dashboards reduce rep productivity and adoption
- Filter 1: The "Actionability" Test (Can the rep control it?)
- Filter 2: The "Leading vs. Lagging" Filter (Does it predict the future?)
- Filter 3: The "Daily Relevance" Filter (Does it matter today?)
- Filter 4: The "Cognitive Load" Filter (Is it easy to understand?)
- How to design a minimalist, high-impact daily dashboard for your sales team
Understanding the Approach
In RevOps, dashboard design is often treated as a data visualization exercise rather than a behavioral engineering task. A "Daily Rep Dashboard" should not be a comprehensive report of all GTM activities; it should be a focused operational tool designed to guide a rep's specific actions for that day.
For example, a CRO might need a dashboard showing overall pipeline generation trends by region (a lagging, macro metric). However, putting that chart on an individual Account Executive's daily dashboard is distracting. The AE needs a dashboard showing which of their specific deals have been in the 'Discovery' stage for more than 14 days without a next meeting booked (an actionable, leading, micro metric).
Why This Matters
Applying strict filters to dashboard design is essential for RevOps to drive CRM adoption and ensure reps are focusing on high-leverage activities.
- Before: Reps ignore the CRM dashboards because they're cluttered with irrelevant marketing and finance metrics. After: Reps use their customized daily dashboard as their primary operational hub to prioritize their day.
- Before: Managers spend 1:1s explaining complex charts and interrogating reps on lagging indicators like win rate. After: Managers use the simplified dashboard to coach reps on specific, actionable leading indicators, like increasing executive engagement on current deals.
- Before: The RevOps team spends hours each week building and maintaining dozens of custom reports that no one looks at. After: RevOps maintains a lean, standardized set of highly utilized dashboards, freeing up time for strategic analysis.
The Complete Guide
Filter 1: The "Actionability" Test
Objective: Ensure every metric on the dashboard can be directly influenced by the rep's daily actions.
Advice: Ask yourself: "If this number is red, what specific action can the rep take today to fix it?" If the answer is "nothing" or "wait for marketing to generate more leads," remove it from the rep's view.
Best Practices: Focus on metrics like "Overdue Tasks," "Deals Missing Next Steps," or "Accounts with No Activity in 30 Days."
Filter 2: The "Leading vs. Lagging" Filter
Objective: Prioritize metrics that predict future success over those that report on past failures.
Advice: While reps need to know their quota attainment (lagging), the majority of their dashboard should focus on leading indicators. Replace "Win Rate" with "Number of Multi-Threaded Deals" or "Discovery Calls Booked."
Best Practices: Leading indicators should align closely with the specific sales methodology your team uses (e.g., MEDDPICC completion rate).
Filter 3: The "Daily Relevance" Filter
Objective: Remove metrics that only matter on a monthly or quarterly basis.
Advice: A rep's daily dashboard should answer: "What do I need to do right now?" Metrics like "Average Sales Cycle Length" are useful for RevOps analysis but are useless to a rep on a Tuesday morning.
Best Practices: Create separate, specialized dashboards for weekly pipeline reviews or monthly business reviews, keeping the daily view ruthlessly focused.
Filter 4: The "Cognitive Load" Filter
Objective: Design the dashboard for instant comprehension.
Advice: Avoid complex scatter plots or multi-axis charts. Use simple lists, clear traffic light indicators (Red/Yellow/Green), and single-number scorecards. A rep should understand their status in 5 seconds.
Best Practices: Limit the daily dashboard to a maximum of 4-6 key components. If you have to scroll, it's too complicated.
How to Implement This
RevOps owns the implementation of these filters. They must have the discipline to push back when sales managers or executives ask to add "just one more chart" to the rep dashboard. RevOps should build the simplified views and ensure the underlying data is accurate. Sales Enablement should train reps on how to use this new, focused dashboard to plan their daily workflow. Sales Leadership must reinforce this by exclusively using the metrics on this daily dashboard to guide their ad-hoc coaching and daily stand-ups.
Next Steps
More data doesn't equal better sales execution. By ruthlessly applying these 4 filters, RevOps can rescue their sales teams from dashboard drowning and provide them with a clear, actionable compass for their daily work.
Start this week by sitting down with one of your top reps and watching how they use their current dashboard. Ask them which charts they actually look at and which ones they ignore. Use that feedback to delete at least three useless metrics today. Ready to build truly actionable, AI-driven workflows? See how Brazn can help.
Drowning in GTM Dashboards? 4 Filters to Get to the Only Metrics Your Reps Need Daily
If you log into the CRM of almost any B2B SaaS company, you'll likely find a sales dashboard that looks like the cockpit of a commercial airliner. There are gauges for call volume, charts for email open rates, leaderboards, pipeline coverage ratios, and a dozen other metrics blinking for attention. The problem? Most sales reps are overwhelmed by this visual noise. When everything is highlighted as important, nothing is.
This dashboard bloat is often the result of RevOps trying to serve too many masters—leadership, marketing, and finance—all on the same screen. The unintended consequence is that the very people who need to take action (the sales reps) ignore the dashboards entirely because they can't quickly discern what they actually need to do today to hit their number.
This article provides a framework for cutting through the clutter. We will introduce 4 essential filters that RevOps can use to strip away the noise and create a hyper-focused, daily dashboard that actually drives rep behavior and revenue outcomes.
What We'll Cover
In this article, we will cover:
- Why complex dashboards reduce rep productivity and adoption
- Filter 1: The "Actionability" Test (Can the rep control it?)
- Filter 2: The "Leading vs. Lagging" Filter (Does it predict the future?)
- Filter 3: The "Daily Relevance" Filter (Does it matter today?)
- Filter 4: The "Cognitive Load" Filter (Is it easy to understand?)
- How to design a minimalist, high-impact daily dashboard for your sales team
Understanding the Approach
In RevOps, dashboard design is often treated as a data visualization exercise rather than a behavioral engineering task. A "Daily Rep Dashboard" should not be a comprehensive report of all GTM activities; it should be a focused operational tool designed to guide a rep's specific actions for that day.
For example, a CRO might need a dashboard showing overall pipeline generation trends by region (a lagging, macro metric). However, putting that chart on an individual Account Executive's daily dashboard is distracting. The AE needs a dashboard showing which of their specific deals have been in the 'Discovery' stage for more than 14 days without a next meeting booked (an actionable, leading, micro metric).
Why This Matters
Applying strict filters to dashboard design is essential for RevOps to drive CRM adoption and ensure reps are focusing on high-leverage activities.
- Before: Reps ignore the CRM dashboards because they're cluttered with irrelevant marketing and finance metrics. After: Reps use their customized daily dashboard as their primary operational hub to prioritize their day.
- Before: Managers spend 1:1s explaining complex charts and interrogating reps on lagging indicators like win rate. After: Managers use the simplified dashboard to coach reps on specific, actionable leading indicators, like increasing executive engagement on current deals.
- Before: The RevOps team spends hours each week building and maintaining dozens of custom reports that no one looks at. After: RevOps maintains a lean, standardized set of highly utilized dashboards, freeing up time for strategic analysis.
The Complete Guide
Filter 1: The "Actionability" Test
Objective: Ensure every metric on the dashboard can be directly influenced by the rep's daily actions.
Advice: Ask yourself: "If this number is red, what specific action can the rep take today to fix it?" If the answer is "nothing" or "wait for marketing to generate more leads," remove it from the rep's view.
Best Practices: Focus on metrics like "Overdue Tasks," "Deals Missing Next Steps," or "Accounts with No Activity in 30 Days."
Filter 2: The "Leading vs. Lagging" Filter
Objective: Prioritize metrics that predict future success over those that report on past failures.
Advice: While reps need to know their quota attainment (lagging), the majority of their dashboard should focus on leading indicators. Replace "Win Rate" with "Number of Multi-Threaded Deals" or "Discovery Calls Booked."
Best Practices: Leading indicators should align closely with the specific sales methodology your team uses (e.g., MEDDPICC completion rate).
Filter 3: The "Daily Relevance" Filter
Objective: Remove metrics that only matter on a monthly or quarterly basis.
Advice: A rep's daily dashboard should answer: "What do I need to do right now?" Metrics like "Average Sales Cycle Length" are useful for RevOps analysis but are useless to a rep on a Tuesday morning.
Best Practices: Create separate, specialized dashboards for weekly pipeline reviews or monthly business reviews, keeping the daily view ruthlessly focused.
Filter 4: The "Cognitive Load" Filter
Objective: Design the dashboard for instant comprehension.
Advice: Avoid complex scatter plots or multi-axis charts. Use simple lists, clear traffic light indicators (Red/Yellow/Green), and single-number scorecards. A rep should understand their status in 5 seconds.
Best Practices: Limit the daily dashboard to a maximum of 4-6 key components. If you have to scroll, it's too complicated.
How to Implement This
RevOps owns the implementation of these filters. They must have the discipline to push back when sales managers or executives ask to add "just one more chart" to the rep dashboard. RevOps should build the simplified views and ensure the underlying data is accurate. Sales Enablement should train reps on how to use this new, focused dashboard to plan their daily workflow. Sales Leadership must reinforce this by exclusively using the metrics on this daily dashboard to guide their ad-hoc coaching and daily stand-ups.
Next Steps
More data doesn't equal better sales execution. By ruthlessly applying these 4 filters, RevOps can rescue their sales teams from dashboard drowning and provide them with a clear, actionable compass for their daily work.
Start this week by sitting down with one of your top reps and watching how they use their current dashboard. Ask them which charts they actually look at and which ones they ignore. Use that feedback to delete at least three useless metrics today. Ready to build truly actionable, AI-driven workflows? See how Brazn can help.
####
Book a demo to see how Brazn AI fits into your sales stack.
About the Author

Alex Margarit, Sales AI Expert, SaaS Sales Leader, BMC, ServiceNow, Docusign — 25+ years in SaaS sales.