


The Pipeline Dashboard Diet: Cutting Reports That Don’t Drive Action
Open your CRM right now and look at your primary sales dashboard. How many charts are on it? 10? 20? More? Revenue leaders often fall into the trap of thinking that more data equals better visibility. In reality, a cluttered dashboard creates analysis paralysis. When every metric is highlighted, nothing is a priority.
If a report doesn't directly inform a decision or prompt an action, it's just noise. It's time to put your RevOps team on a "Dashboard Diet." This article provides a framework for ruthlessly pruning your CRM reporting to focus only on the metrics that actually drive revenue behavior.
What We'll Cover
In this article, we will cover:
- The psychological cost of "metric bloat" on sales teams
- The "Actionability Test" for evaluating any report
- The 4 essential dashboards every revenue team needs
- How to gracefully retire outdated reports
- Shifting from passive reporting to proactive alerts
Understanding the Approach
The "Dashboard Diet" is an operational initiative led by RevOps to audit, consolidate, and eliminate unnecessary reporting within the GTM tech stack. The goal is to move from "data vomiting" (showing every possible metric) to "insight curation" (showing only the metrics that dictate the next best action).
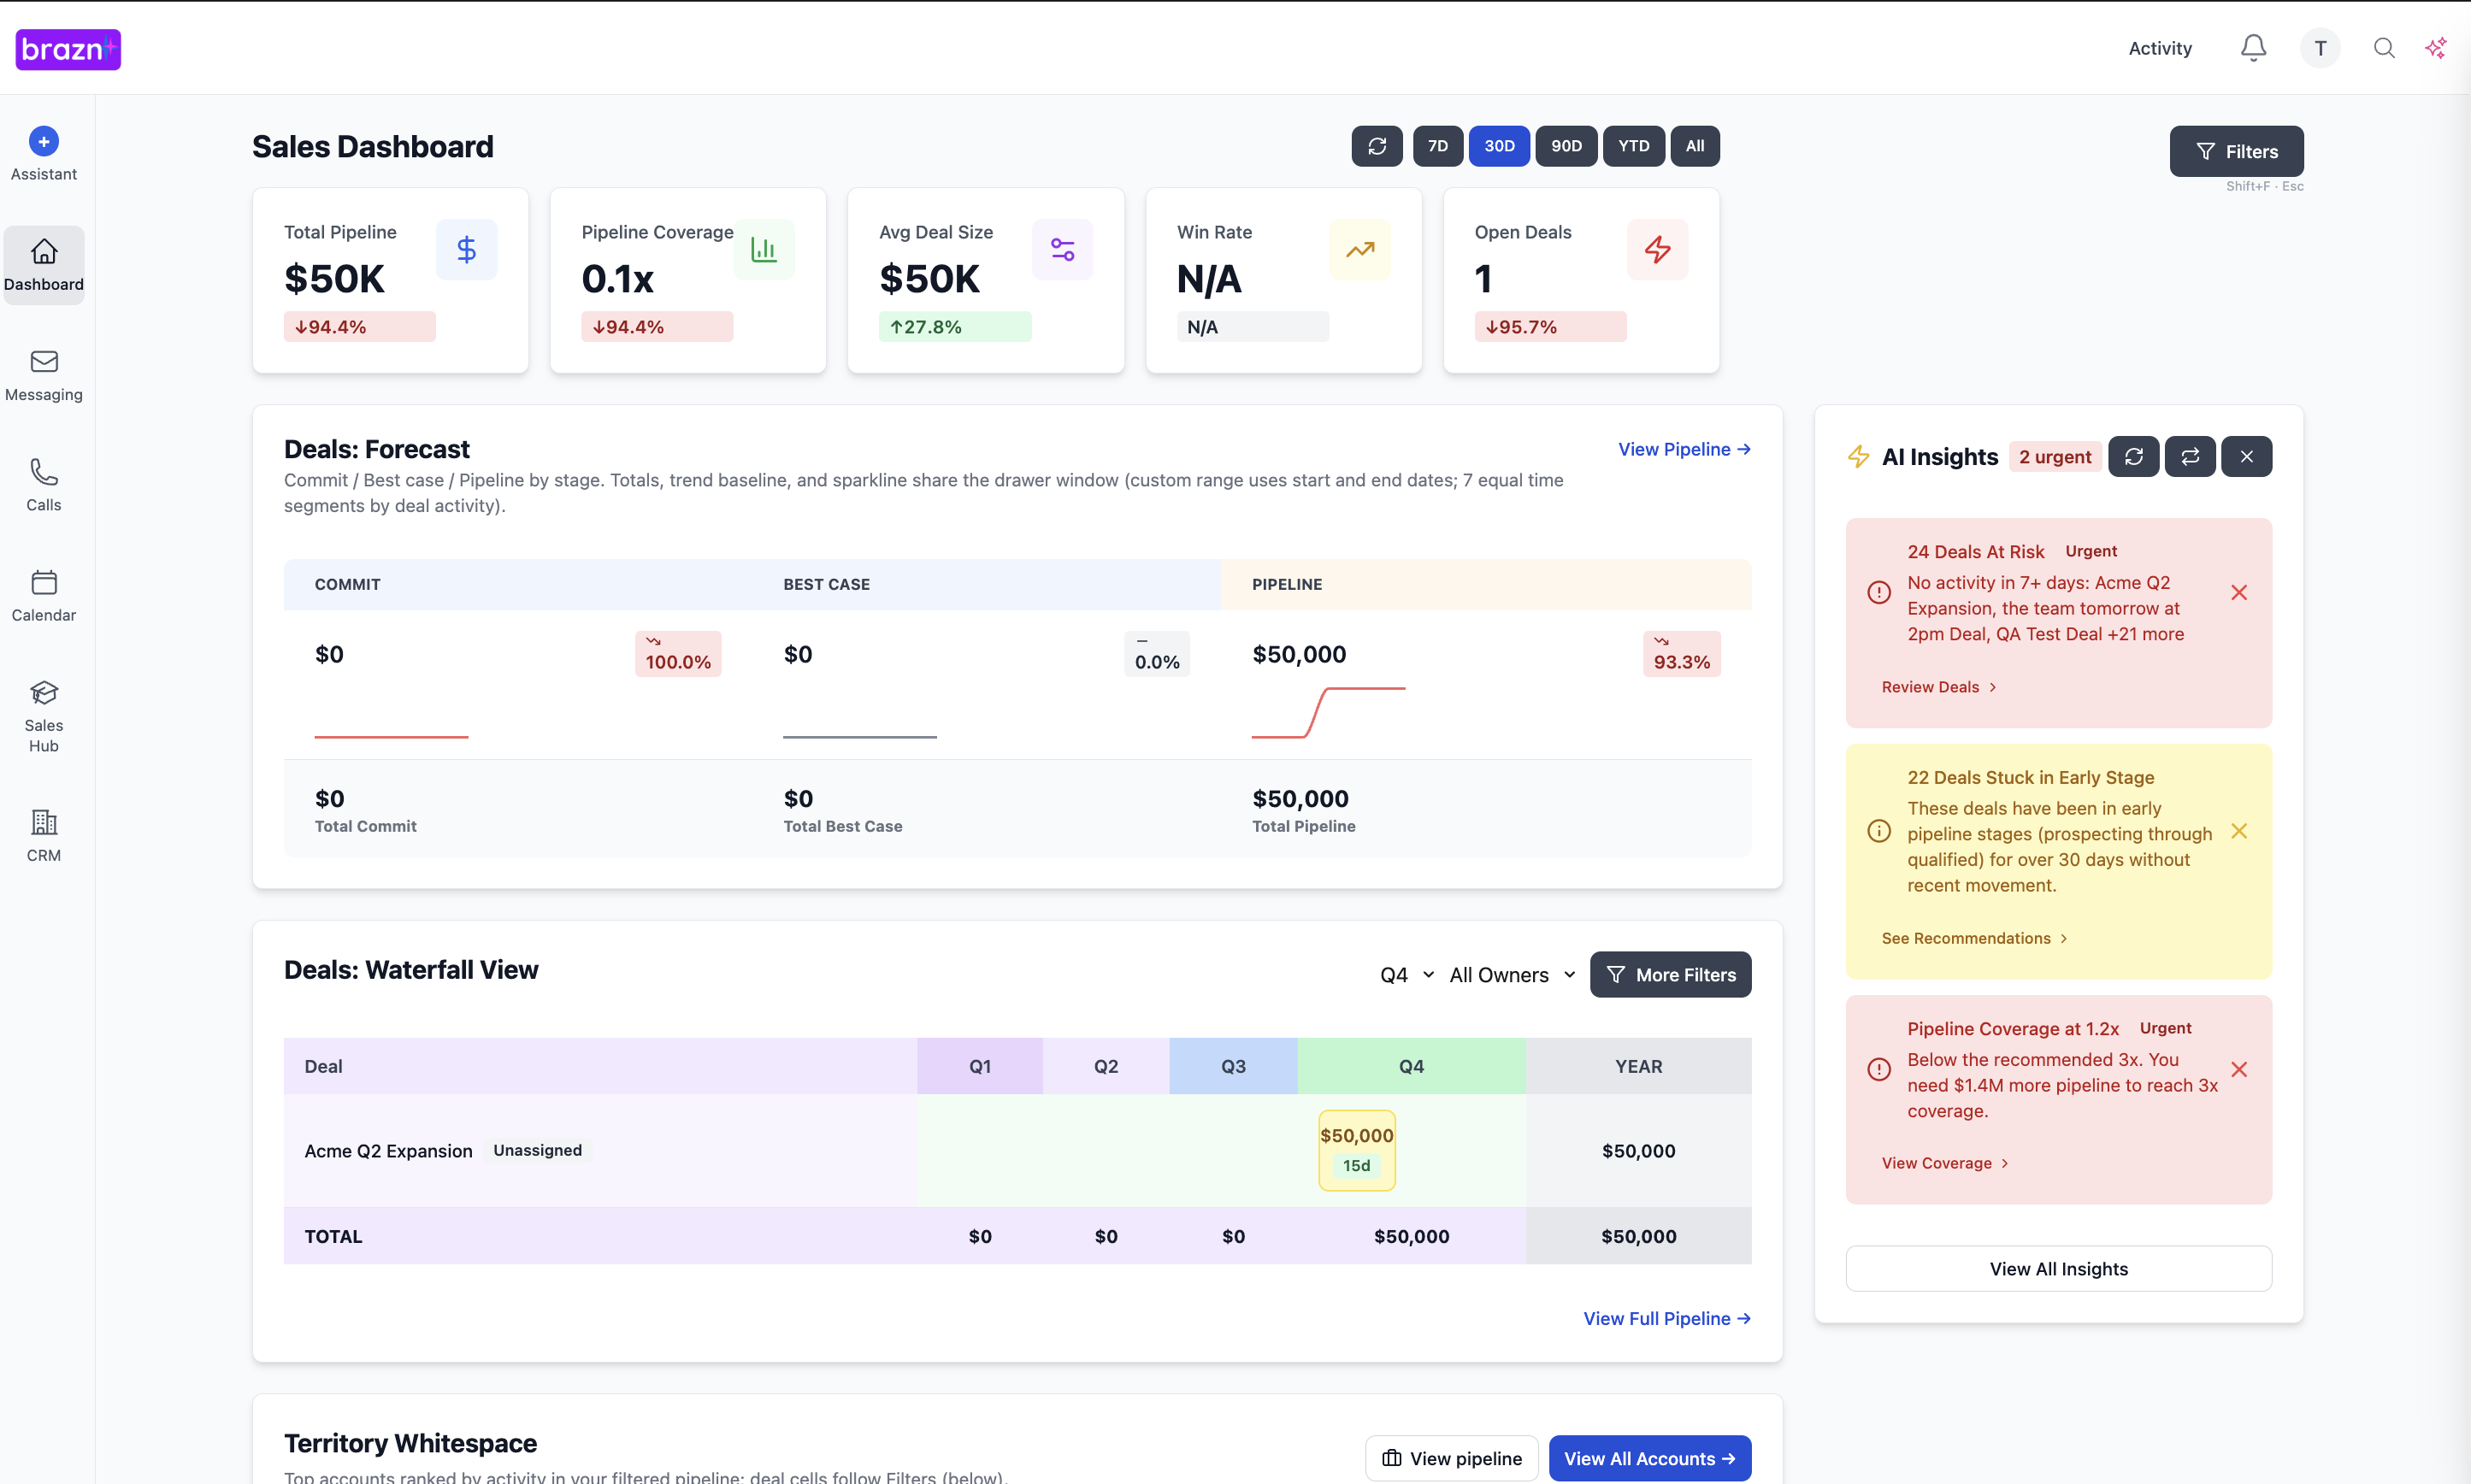
Example: A traditional dashboard might show a pie chart of "Leads by Industry." This is interesting, but not actionable. A curated dashboard replaces that with a list of "High-Intent Leads in Target Industries Without a Follow-Up in 48 Hours." The first is a vanity metric; the second is a prioritized to-do list for the SDR team.
Why This Matters
Streamlining your reporting architecture is essential for focusing your team's energy and improving the speed of decision-making.
- Before: Sales managers spend hours trying to interpret complex dashboards before their 1:1s. After: Managers instantly see the 3-4 metrics that matter, allowing them to focus on coaching.
- Before: Reps ignore the CRM dashboards because they're confusing and irrelevant to their daily tasks. After: Reps rely on clean, action-oriented dashboards to prioritize their day.
- Before: RevOps is bogged down with constant requests for custom, one-off reports. After: RevOps maintains a lean, standardized reporting structure, freeing up time for strategic projects.
The Complete Guide
H3 Step 1: The "Actionability Test"
Objective: Identify the reports that are just noise.
Actionable Advice: Review every chart on your main dashboard and ask: "If this number goes up or down by 20% tomorrow, what specific action will we take?" If the answer is "nothing" or "we'd look into it," delete the report.
Best Practices: Be ruthless. "It's good to know" isn't a valid reason to keep a report on a primary dashboard.
H3 Step 2: Define the Core Dashboards
Objective: Create role-specific visibility.
Actionable Advice: You only need four primary dashboards: 1) The Rep Dashboard (focused on daily tasks and pipeline generation), 2) The Manager Dashboard (focused on deal velocity and rep coaching), 3) The Executive Dashboard (focused on high-level forecasting and GTM efficiency), and 4) The Marketing Dashboard (focused on pipeline sourcing).
Best Practices: Ensure each role only sees the dashboard relevant to their daily execution.
H3 Step 3: Shift to Exception Reporting
Objective: Move from passive monitoring to active alerting.
Actionable Advice: Instead of requiring managers to constantly check a dashboard to find stalled deals, use your CRM or AI tools to set up automated alerts. For example, trigger a Slack message to the manager when a "Commit" deal has its close date pushed twice.
Best Practices: Exception reporting ensures that leaders only spend time looking at data when an intervention is actually required.
H3 Step 4: The "Sunset" Process
Objective: Remove old reports without causing panic.
Actionable Advice: When you decide to delete a popular (but useless) report, don't just turn it off. Communicate the change to the team, explain why it's being removed (it didn't drive action), and show them the new, better metric they should focus on instead.
Best Practices: Create an "Archive" folder for old reports before permanently deleting them, just in case.
How to Implement This
RevOps is the owner of the Dashboard Diet. They must conduct the audit and build the new, streamlined dashboards. However, the CRO must enforce the discipline. When a manager asks for a custom report on a vanity metric, the CRO must back up RevOps in saying "no" and refocusing the manager on the core KPIs.
Next Steps
More data doesn't equal better decisions. By ruthlessly cutting the reports that don't drive action, you can provide your team with the clarity they need to execute effectively.
Open your primary CRM dashboard today and apply the "Actionability Test" to the first five charts. Delete at least two of them. Your team will thank you for the clarity. Ready to move from passive dashboards to proactive insights? See how Brazn's AI surfaces the actions that matter most.
Book a demo to see how Brazn AI fits into your sales stack.

About the Author

Alex Margarit, Sales AI Expert, SaaS Sales Leader, BMC, ServiceNow, Docusign — 25+ years in SaaS sales.