

The Operating Metrics That Predict Next Quarter’s Revenue
Most revenue dashboards are essentially rear-view mirrors. They tell you what happened last quarter—revenue closed, deals lost, churn rate. While this historical data is important for reporting, it's useless for changing the future. If you only look at lagging indicators, you will always be reacting to problems rather than preventing them.
To gain control over your revenue engine, you must shift your focus to leading indicators—the operational metrics that predict future outcomes. This article identifies the specific leading indicators that top revenue leaders track to forecast next quarter's revenue with high confidence.
What We'll Cover
In this article, we will cover:
- The critical difference between lagging and leading indicators
- Why historical win rates aren't enough for accurate forecasting
- 3 leading indicators for pipeline generation
- 3 leading indicators for deal velocity and health
- How RevOps can build a predictive forecasting model
Understanding the Approach
An "Operating Metric" (or Leading Indicator) is a measurable activity or signal that occurs early in the sales cycle and has a high statistical correlation with a future outcome (like a closed-won deal). In a RevOps context, tracking these metrics allows leaders to identify pipeline gaps or at-risk deals early enough to intervene and change the trajectory of the quarter.
Example: "Closed-Won Revenue" is a lagging indicator. "Number of First Meetings Booked" is a leading indicator. If your "First Meetings Booked" drops by 20% in October, you can predict with near certainty that your "Closed-Won Revenue" will drop in January (assuming a 90-day sales cycle).
Why This Matters
Shifting from reactive reporting to predictive forecasting is the hallmark of a mature revenue organization.
- Before: The CRO discovers a pipeline shortfall halfway through the quarter, leading to panic and desperate discounting. After: The CRO identifies the shortfall months in advance based on early indicators and adjusts top-of-funnel spend accordingly.
- Before: Forecasts are based on rep intuition, leading to high variance and low board confidence. After: Forecasts are based on mathematical models driven by leading indicators, providing high accuracy.
- Before: Managers coach reps on deals that are already lost. After: Managers use leading indicators to identify deals that are stalling and intervene while they can still be saved.
The Complete Guide
H3 Leading Indicators for Pipeline Generation
1. Meeting Conversion Rate: The percentage of outbound activities (calls, emails) that result in a booked meeting. A drop here indicates a messaging or targeting problem.
2. High-Intent Website Traffic: The volume of visitors engaging with high-value pages (e.g., Pricing, Demo Request) rather than just reading blog posts.
3. SDR Activity to Opportunity Ratio: How many activities it takes to create a qualified opportunity. This measures the efficiency of your outbound motion.
H3 Leading Indicators for Deal Velocity
1. Time in Stage: The number of days a deal sits in a specific CRM stage. Deals that exceed the historical average are highly likely to slip or be lost.
2. Multi-Threading Depth: The number of unique contacts engaged in a deal. Deals with only one contact have a significantly lower win rate.
3. Next Steps Scheduled: The percentage of open opportunities that have a firm, calendar-invited next step. Deals without a scheduled next step aren't real pipeline.
How to Implement This
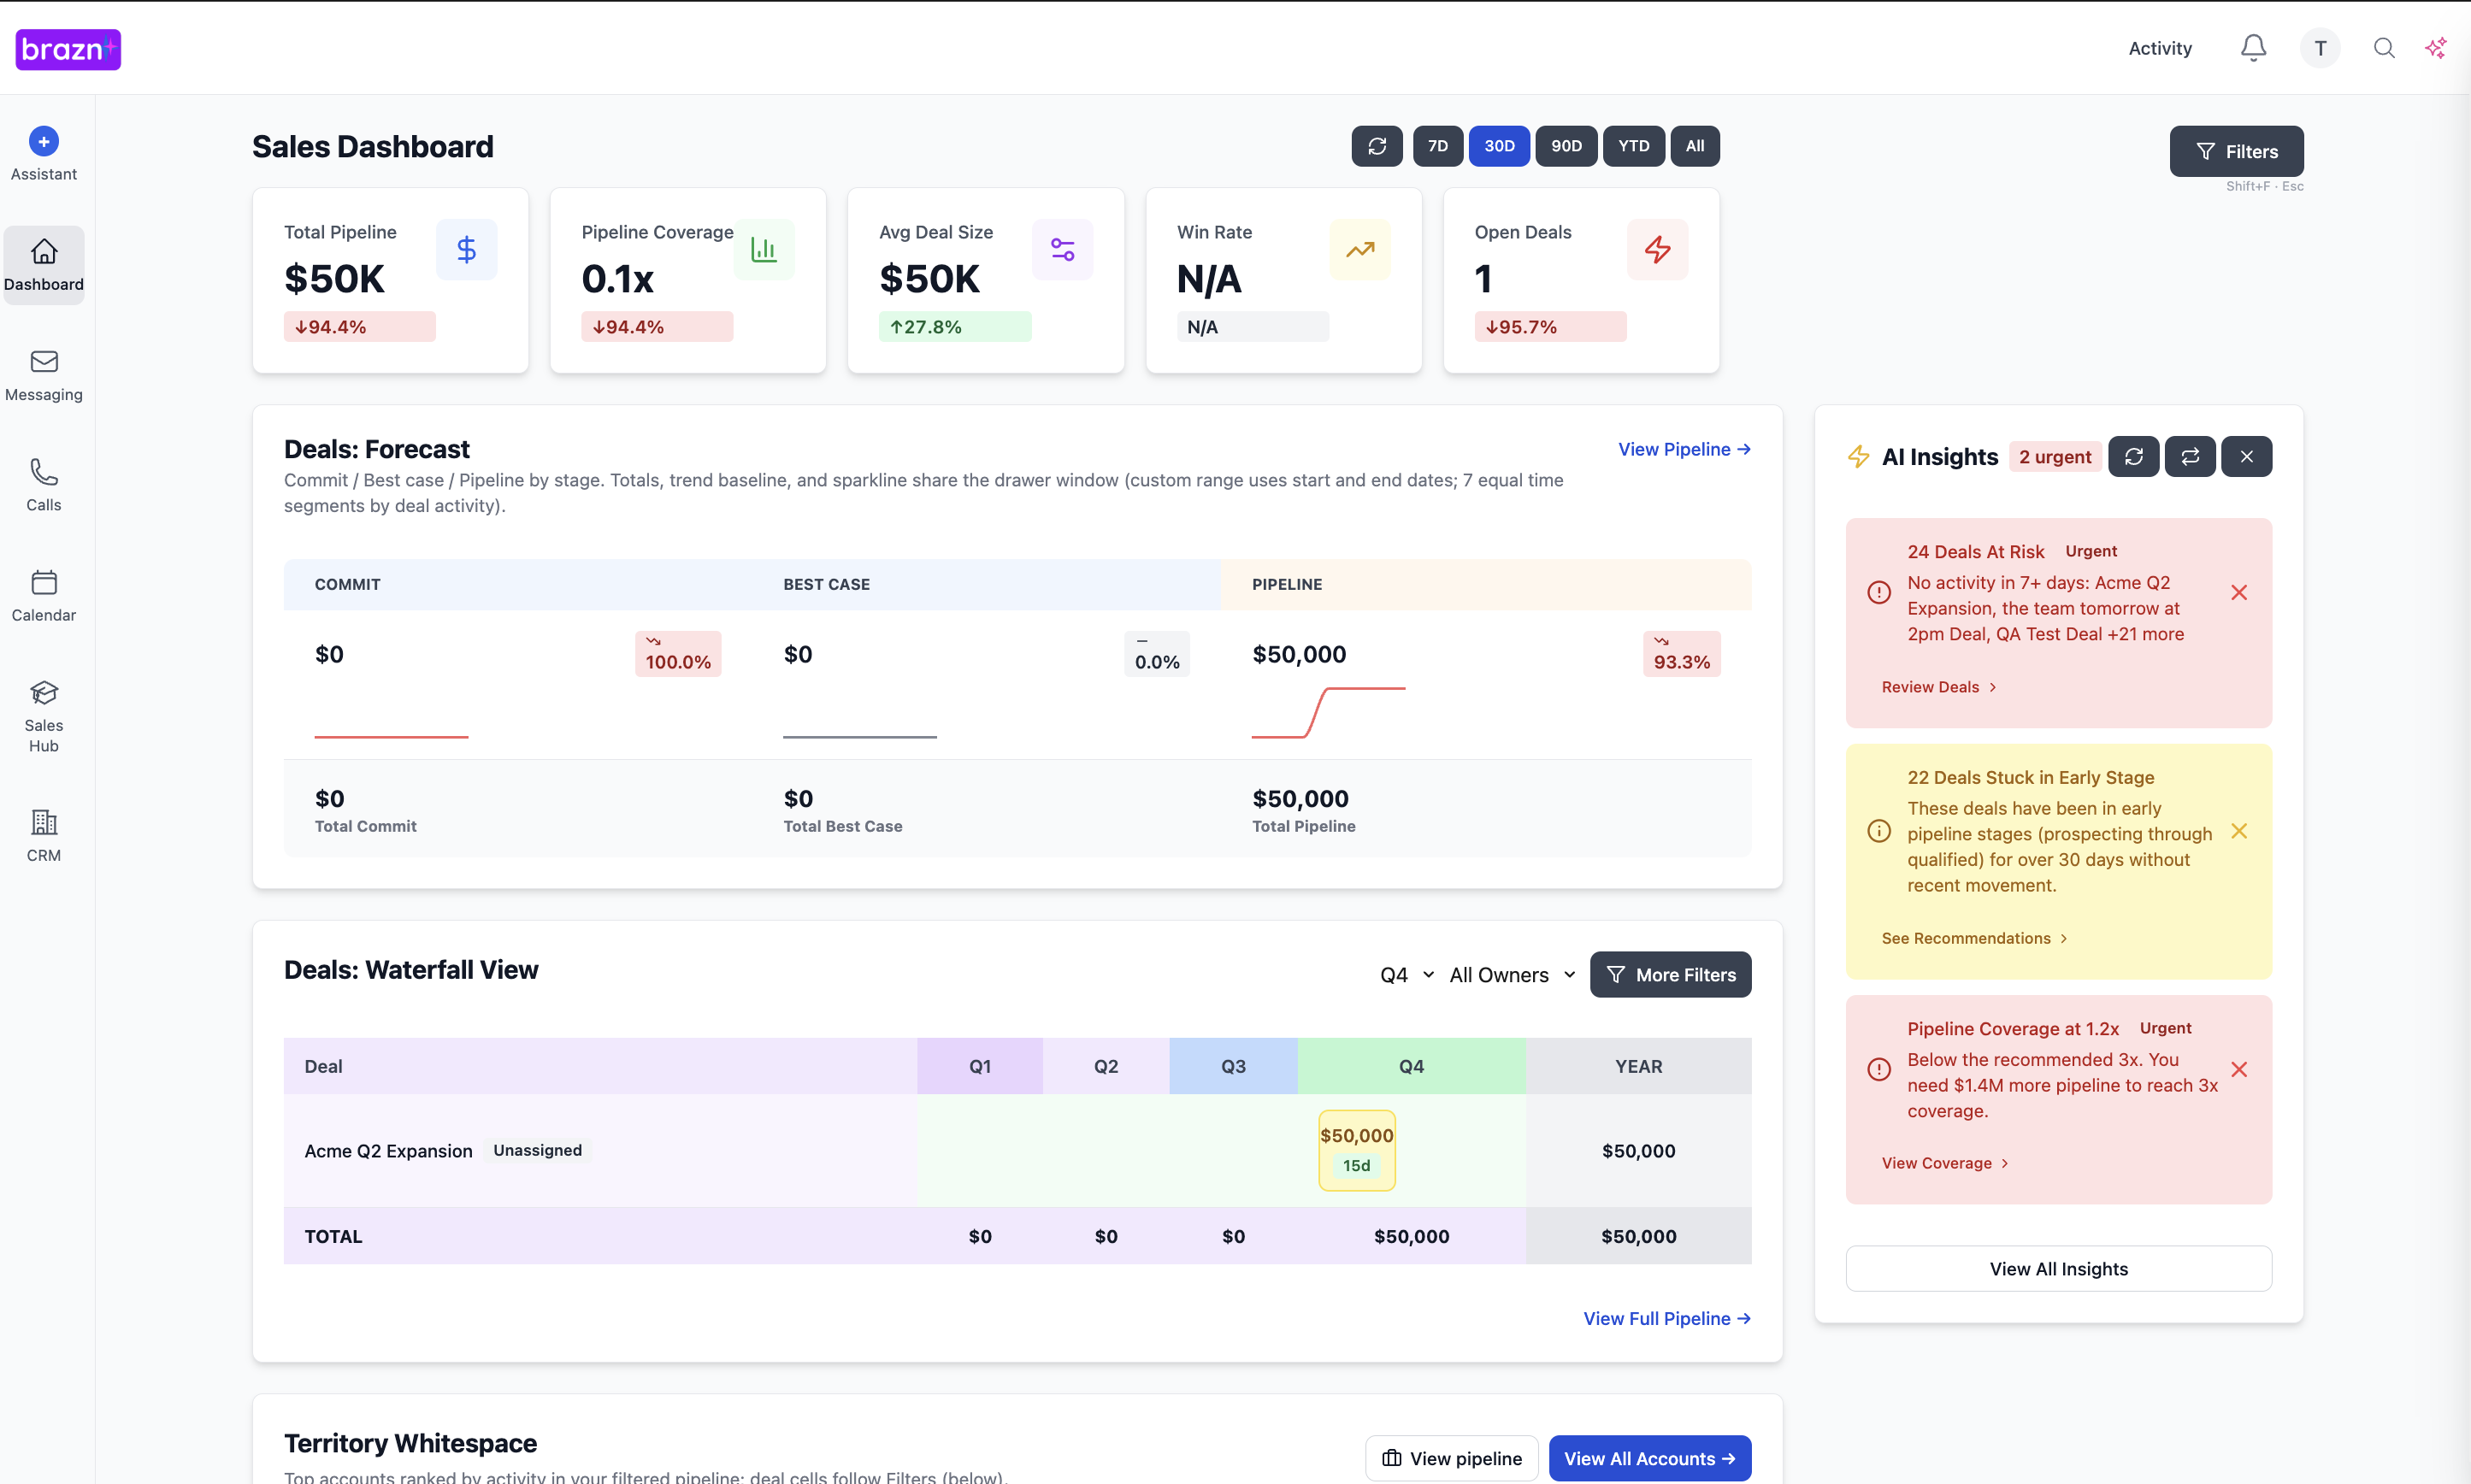
RevOps is responsible for identifying the leading indicators that are most predictive for your specific business model. They must configure the CRM to track these metrics automatically (e.g., using conversational intelligence to track multi-threading) and build early-warning dashboards for sales managers. Managers must then use these dashboards to guide their weekly 1:1 coaching sessions.
Next Steps
You can't manage what has already happened. By focusing on the operational metrics that predict future outcomes, you can transition from a reactive manager to a proactive revenue architect.
Pick one leading indicator—such as "Deals without a scheduled next step"—and pull a report on it today. You will instantly identify the hidden risks in your current pipeline. Ready to move from reactive reporting to predictive forecasting? Discover how Brazn's AI models identify the signals that predict revenue.
Book a demo to see how Brazn AI fits into your sales stack.

About the Author

Alex Margarit, Sales AI Expert, SaaS Sales Leader, BMC, ServiceNow, Docusign — 25+ years in SaaS sales.