

The 9 GTM KPIs That Tell You If Strategy Is Actually Working
Revenue strategy is often built on grand visions and ambitious goals, but the execution is where most teams fail. The problem? many organizations measure their success using lagging indicators—Total Revenue, Win Rate, or Customer Churn. While these metrics are important for the board, they tell you what happened in the past. If you wait until the end of the quarter to realize your win rate has dropped, it's too late to fix the strategy. You are driving by looking in the rearview mirror.
To know if your Go-To-Market strategy is actually working right now, you need to track leading indicators—metrics that predict future outcomes. This article outlines the 9 essential GTM KPIs that provide real-time feedback on your strategy, allowing you to course-correct before the quarter is lost.
What We'll Cover
In this article, we will cover:
- The difference between leading and lagging indicators in GTM
- Why relying solely on revenue targets is dangerous
- 9 critical KPIs that prove your strategy is working
- How to align Sales, Marketing, and CS around these metrics
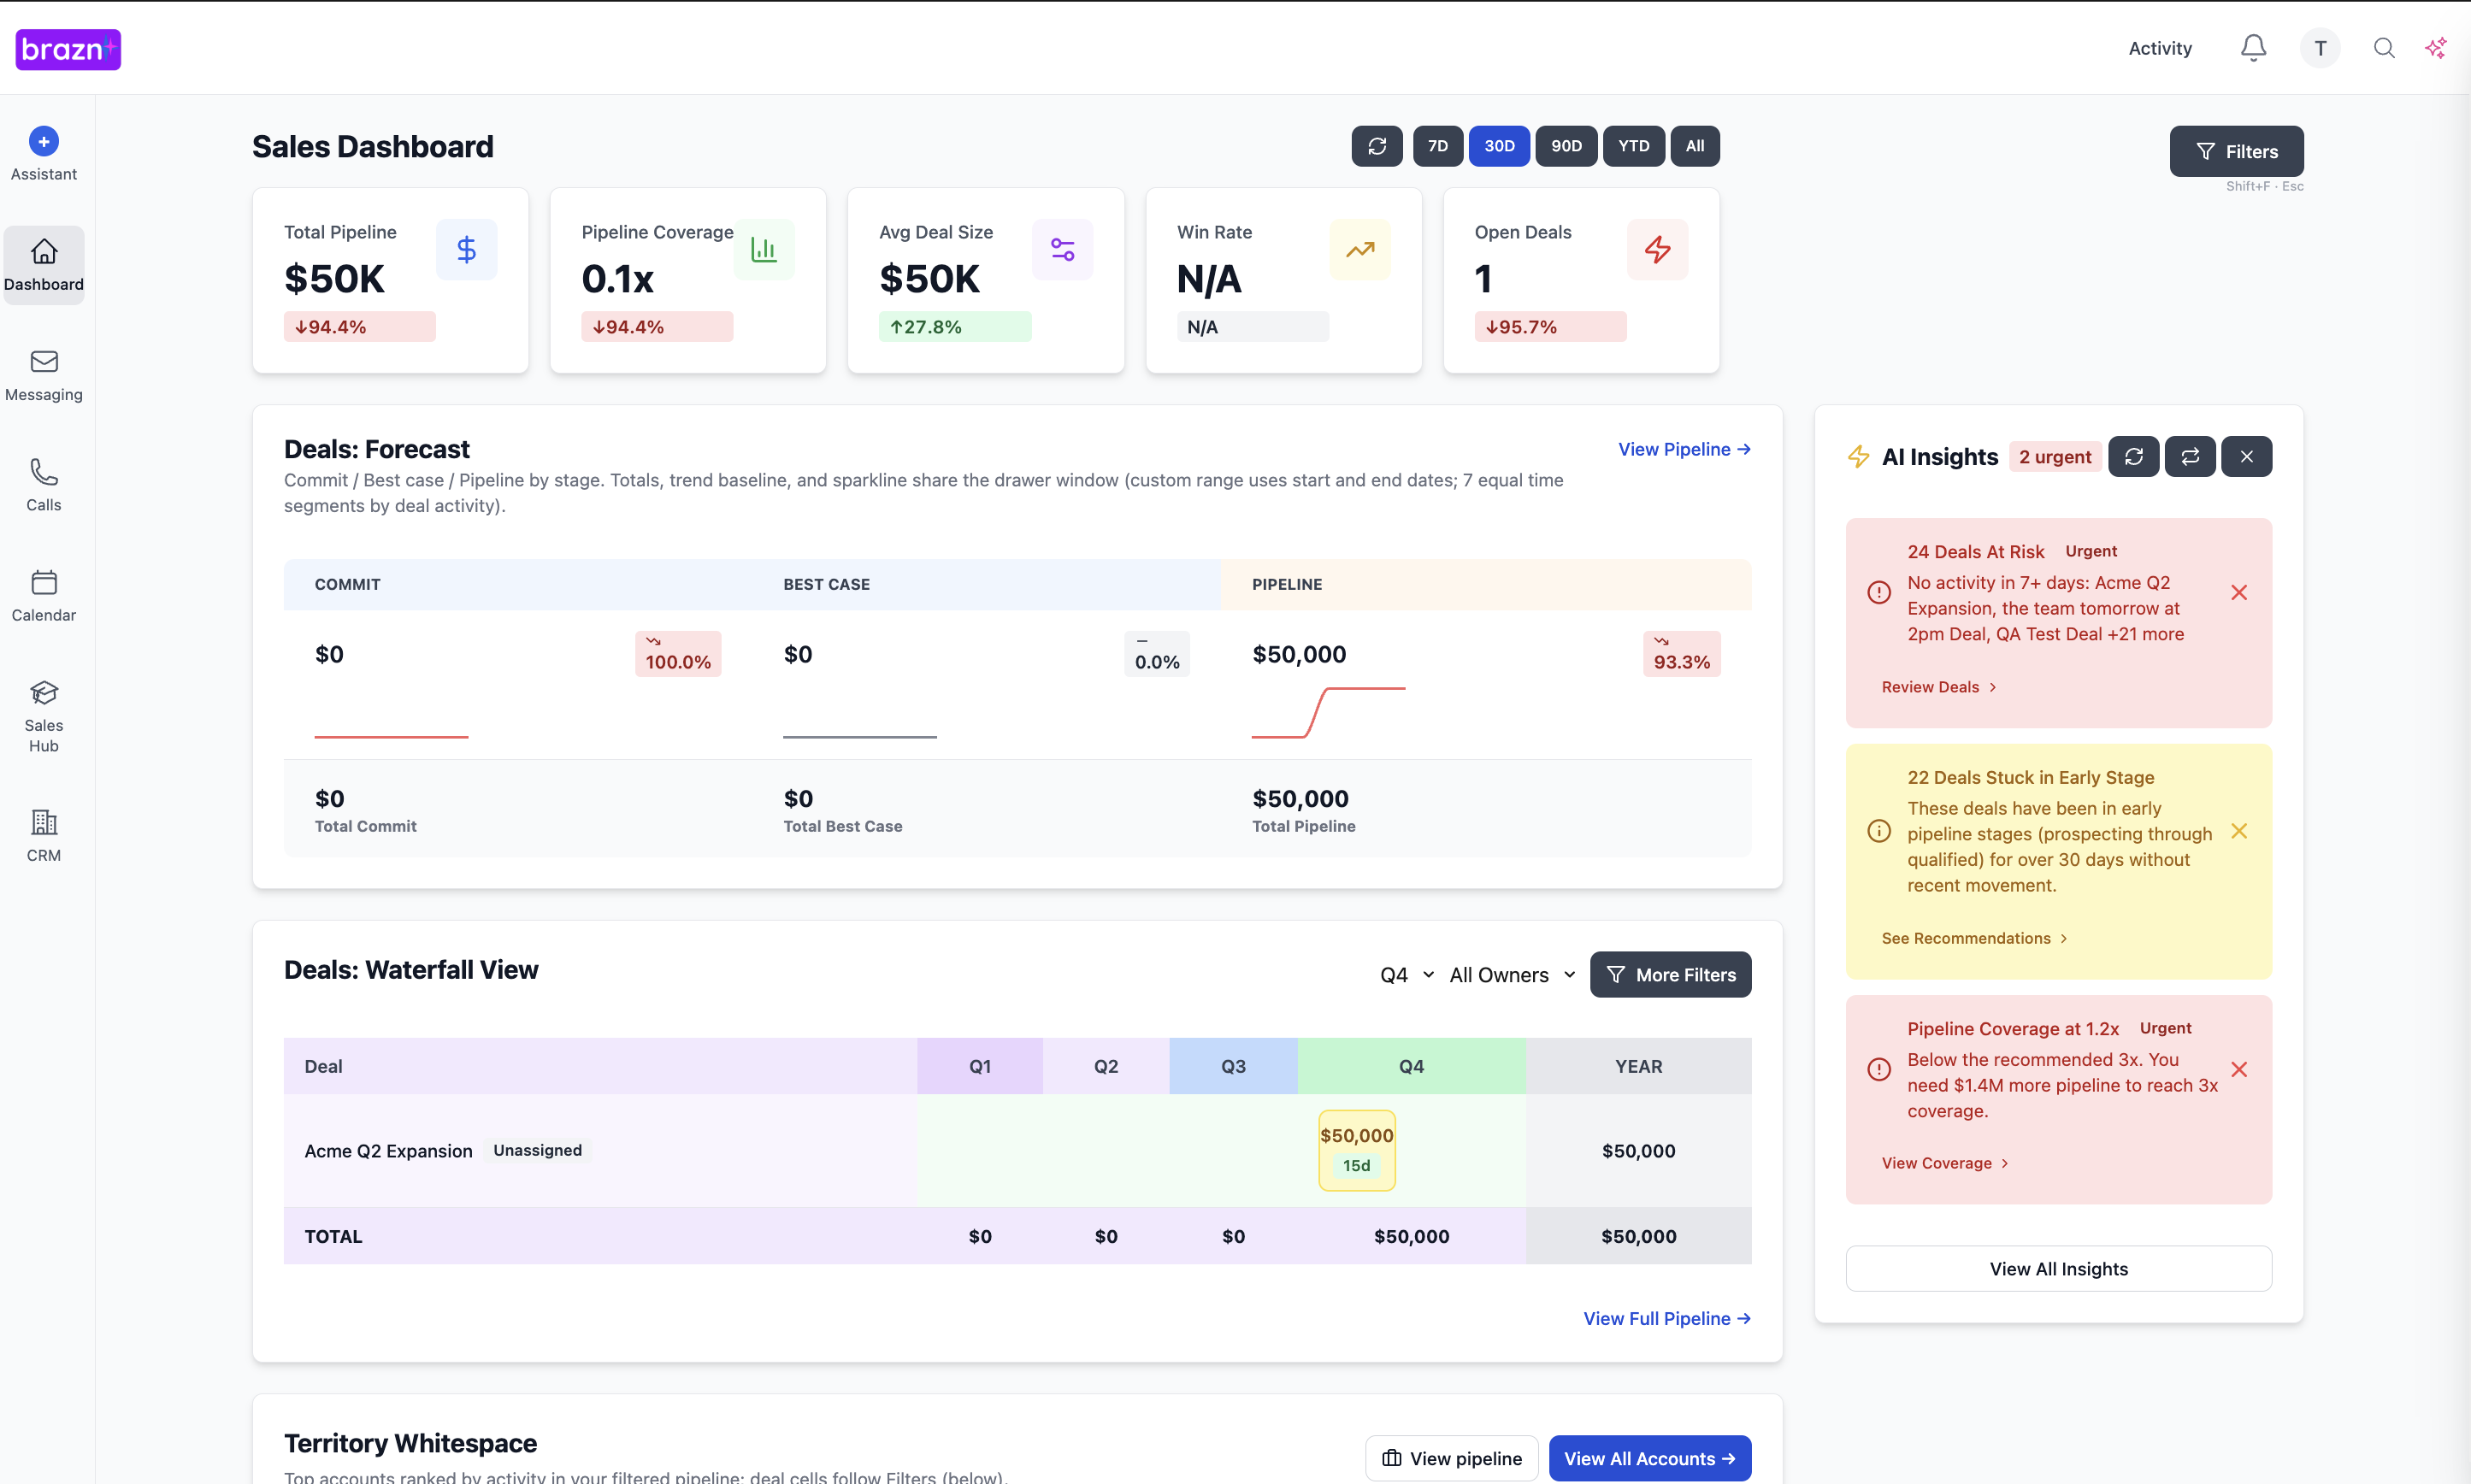
- Building a real-time GTM dashboard
Understanding the Approach
A 'Leading Indicator KPI' is a measurable value that changes before the primary outcome (like revenue) changes. In a GTM context, these metrics track the behaviors, activities, and early-stage conversions that indicate whether the current strategy will successfully generate future revenue.
Example: 'Total ARR' is a lagging indicator. 'Discovery-to-Demo Conversion Rate' is a leading indicator. If the conversion rate drops this week, it's a leading indicator that you will likely miss your ARR target next month, giving you time to investigate and fix the discovery process.
Why This Matters
Shifting focus to leading indicators allows revenue teams to be agile, proactive, and data-driven in their execution.
- Before: The team misses the quarterly target and spends weeks arguing over why it happened. After: The team identifies a drop in a leading indicator in week 3, adjusts the messaging, and saves the quarter.
- Before: Marketing and Sales argue over lead quality based on subjective opinions. After: Both teams align on a shared leading indicator (e.g., Sales Accepted Lead conversion rate) to objectively measure quality.
- Before: Managers coach reps based on gut feeling. After: Managers use specific KPI drops (e.g., low multi-threading rates) to provide targeted, data-backed coaching.
The Complete Guide
H3 Top of Funnel (Marketing & SDR)
1. High-Intent Website Conversion Rate: Are the right people visiting, and are they taking action? (Measures messaging resonance).
2. SDR Connection-to-Meeting Rate: When we get a prospect on the phone, do they agree to meet? (Measures the strength of the initial value proposition).
3. Sales Accepted Lead (SAL) Rate: Is Sales actually accepting the leads Marketing/SDRs generate? (Measures alignment on the Ideal Customer Profile).
H3 Middle of Funnel (Sales Execution)
1. Discovery-to-Proposal Conversion Rate: Are we effectively qualifying and building a business case? (Measures discovery skills and product-market fit).
2. Average Deal Velocity (Days in Stage): Are deals moving through the pipeline at the expected speed? (Measures momentum and the effectiveness of the Mutual Action Plan).
3. Multi-Threading Index: How many distinct stakeholders are engaged in active opportunities? (Measures deal security and consensus-building).
H3 Bottom of Funnel & Expansion (Sales & CS)
1. Competitive Win Rate: When we go head-to-head with our primary rival, how often do we win? (Measures product differentiation and battlecard effectiveness).
2. Time-to-First-Value (TTFV): How quickly does a new customer achieve their first significant ROI? (Measures implementation efficiency and sets the stage for renewal).
3. Net Revenue Retention (NRR) Leading Indicators: E.g., Product adoption depth or executive sponsor engagement. (Measures the health of the account before the renewal conversation begins).
How to Implement This
RevOps is the custodian of these KPIs. They must build the dashboards that track these metrics in real-time and ensure the data feeding them is accurate. However, the CRO must enforce the discipline of reviewing these metrics weekly in GTM leadership meetings. If a KPI is trending red, the relevant leader (CMO, VP of Sales, VP of CS) must own the action plan to correct it.Next Steps
Strategy is a hypothesis; these 9 KPIs are the experiment that proves it right or wrong. By obsessing over leading indicators, you transition from hoping you hit your numbers to engineering the exact behaviors required to achieve them.
Start small: Pick one leading indicator from the list above (e.g., Discovery-to-Proposal Conversion Rate) and track it closely for the next two weeks. See what it tells you about your pipeline health. Ready to automate your GTM reporting? Discover how Brazn provides real-time visibility into the metrics that matter.
Book a demo to see how Brazn AI fits into your sales stack.

About the Author

Alex Margarit, Sales AI Expert, SaaS Sales Leader, BMC, ServiceNow, Docusign — 25+ years in SaaS sales.